An introduction to the Dashboard Designer – FREE Download
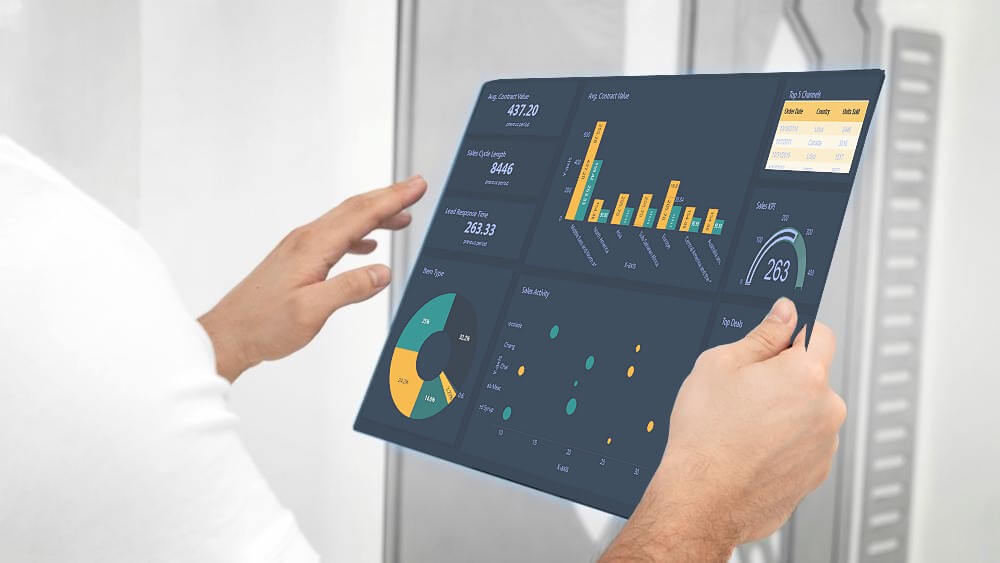
The Dashboard Designer is a versatile tool that empowers users to create visually appealing and interactive dashboards.In today's fast-paced business environment, data visualization has become a crucial aspect of decision-making. Organizations across industries are leveraging the power of dashboards to gain insights and monitor key metrics effectively. In this article, we will explore the features and functionalities of the Dashboard Designer, and discuss how it can be utilized to build impactful dashboards for web applications.
Understanding the Dashboard Designer
The Dashboard Designer is a powerful tool that allows users to create and customize dashboards according to their specific requirements. It offers the Web Dashboard Designer. Let's take a closer look at this feature.
Transforming Data into Actionable Web Dashboard with the Dashboard Designer
The Dashboard Designer is a powerful tool that allows users to create dashboards directly in a web browser. With its browser-based interface, the Dashboard Designer provides a convenient and accessible solution for designing dashboards on the go. To get started with the Dashboard Designer, you can refer to the "How to use the Dashboard Designer" section in this article, which provides a comprehensive guide on creating a web-based dashboard application.
Once you have set up the Web Dashboard Designer, you can explore its various features and customize the dashboard control. The "Web Dashboard" documentation offers insights on how to prepare and customize the Web Dashboard control. Additionally, this article provides step-by-step instructions on designing dashboards in the Web Dashboard Designer.
Features and Functionalities
The Designer offers a wide range of features and functionalities that enable users to create dynamic and interactive dashboards. Let's explore some of the key features of the Dashboard Designer.
Data Source Connectivity
The Dashboard Designer allows users to connect to various data sources, including databases, spreadsheets, and web services. This flexibility enables users to retrieve real-time data and create dynamic dashboards that reflect the most up-to-date information. The Designer supports a wide range of data connectors, ensuring compatibility with popular data sources.
Drag-and-Drop Interface
The intuitive drag-and-drop interface of the Dashboard Designer makes it easy for users to add and arrange data visualizations on the dashboard canvas. Users can simply drag and drop data elements, such as charts, tables, and gauges, onto the canvas and position them according to their preferences. This user-friendly approach eliminates the need for extensive coding or technical expertise, empowering users to create dashboards with ease.
Visualization Customization
The Dashboard Designer offers extensive customization options for data visualizations. Users can modify the appearance, layout, and behavior of individual elements to create visually stunning dashboards that align with their branding and design preferences. The Designer provides a wide range of customization tools, including color palettes, font styles, and interactive elements, allowing users to create engaging and impactful dashboards.
Interactivity and Drill-Down Capabilities
Dashboards created with the Dashboard Designer can be interactive, enabling users to explore data and gain insights through drill-down capabilities. Users can define interactive elements, such as filters and parameters, to allow end-users to interact with the dashboard and view specific data subsets. This interactivity enhances the user experience and empowers users to extract meaningful insights from the dashboard.
Collaboration and Sharing
The Dashboard Designer facilitates collaboration and sharing by providing options to publish dashboards to various platforms. Users can export dashboards as standalone applications or embed them within existing applications. The Designer also supports sharing dashboards via email or through web-based portals, allowing multiple stakeholders to access and interact with the dashboard simultaneously.
Benefits of Using the Dashboard Designer
The Dashboard Designer offers numerous benefits that make it a valuable tool for organizations looking to leverage data visualization. Let's explore some of the key benefits of using the Dashboard Designer.
1. Enhanced Data Visualization
The Dashboard Designer empowers you to transform raw data into visually stunning and easy-to-understand visualizations. With a wide range of customizable charts, graphs, and widgets at your disposal, you can present complex data in a visually appealing manner. This enhanced data visualization capability enables stakeholders to quickly grasp insights and make informed decisions.
2. Interactive and Real-Time Insights
The Dashboard Designer allows you to create interactive dashboards that enable users to explore data in real-time. With intuitive filtering and drill-down capabilities, users can dive deep into the data and uncover valuable insights. This interactivity fosters a data-driven culture within organizations and empowers users to make informed decisions based on real-time data.
3. Seamless Collaboration
Collaboration is crucial in today's fast-paced business environment. The Dashboard Designer offers seamless collaboration features, allowing multiple users to work on the same dashboard simultaneously. This promotes teamwork, ensures data consistency, and accelerates the dashboard creation process. With the ability to share dashboards easily, you can facilitate effective communication and alignment across teams.
4. Cross-Platform Flexibility
The Dashboard Designer provides cross-platform flexibility. This means you can create dashboards on the platform that best suits your needs and seamlessly transition between platforms if required. This flexibility ensures that you can cater to the diverse needs of your users and leverage the power of data visualization across different devices and operating systems.
5. Extensive Customization Options
Every business has unique requirements when it comes to data visualization. The Dashboard Designer offers extensive customization options, allowing you to tailor the appearance and functionality of your dashboards to align with your brand and specific needs. From color schemes and themes to interactive elements and layout options, the Dashboard Designer enables you to create dashboards that are truly reflective of your organization's identity.
How to Use the Dashboard Designer
APPLIES TO: On-premises Online Desktop

In this article, we'll use the Dashboard Builder Tool to design a dashboard and retrieve data from a PostgreSQL database, as well as generate PHP source code.
Prerequisites
PosgreSQL Dashboard can be installed any platforms like Windows, Linux and Ubuntu or any other platforms support Apache, Nginx etc.
Requirements
- PHP Version 7.2 or later
- Apache 2 or later
- PostgreSQL database
- PDO and pdo_pgsql
- Windows 7 or later /Linux 3 or later
- Firefox 52, Chrome 57, IE
- PostgreSQL Dashboard is available for downloading
Installation
There is a Free version of the Dashboard Designer available for trail bases,
- You can download the Dashboard Designer dashboard code fromDownload Dashboard Designer
- Place the files in a directory on the web server. e.g.
…/www/yoursite/dashbboardbuilder-v3-FREE/ - Unzip
 the file dashboard.zip using Extract Here option to the root folder of "dashboardbuilder"
Steps to build PostgreSQL dashboard
STEP-1: Connect with PostgreSQL Database
- Run the web folder in your browser. e.g. http://localhost/dashboardbuilder following welcome screen will appear.
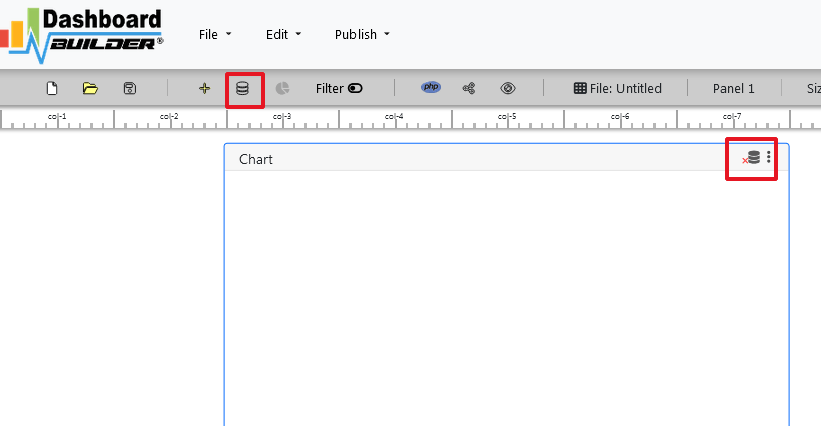
"database-name" in the DB name field and click Save changes button.

Tip: If your database is not in the public schema, then you can use your schema name in this manner 127.0.0.1:5432/Schema in the host field.
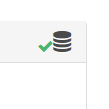
- When you click the save changes, a green tick mark with Database will appear that shows that your database is successfully connected.
Tip: To retrive data from PostgreSQL database, PDO driver 'pdo_pgsql' must be installed. For more details please have a look at our Documentation
STEP-2: Chart settings
- After successfully connect to your PostgreSQL database, we will retrieve data from your database in our next step.
- Select the gear icon.
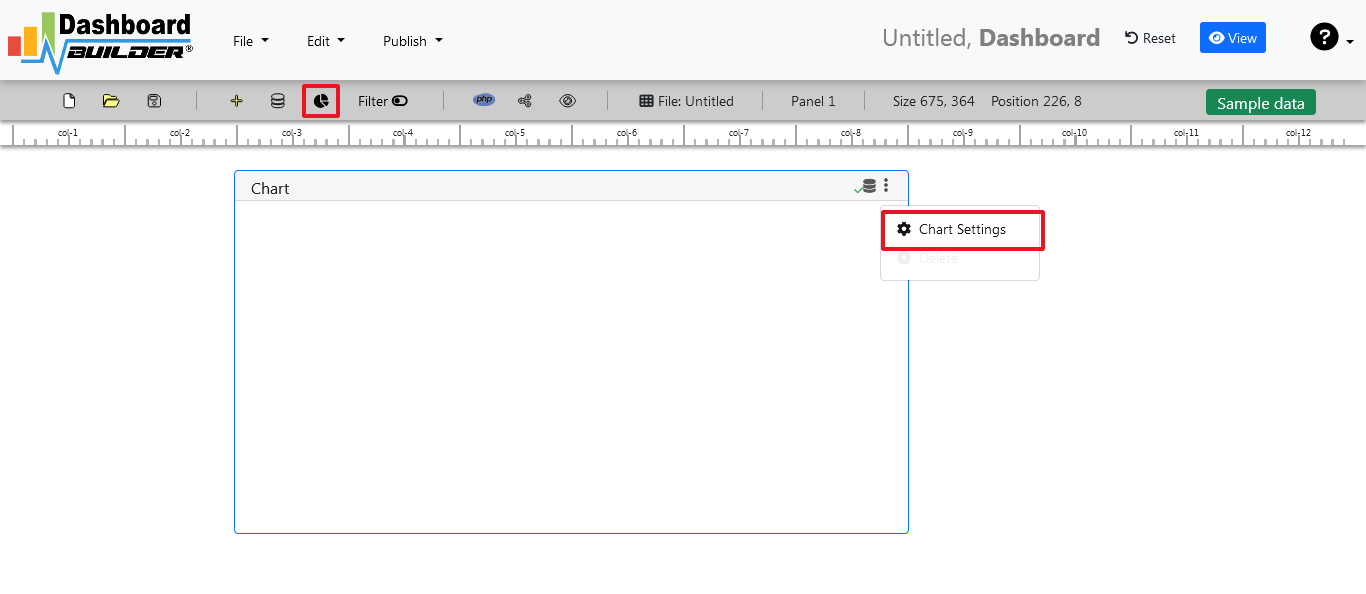
- A pop-up screen will appear and a list of the tables from your PostgreSQL database will appear on the table list as shown in the picture below.

PostgreSQL dashboards have a powerful Query Builder, a smart SQL statement builder tool for quick and easy writing of complex SQL queries without manual code writing which is designed to simplify the retrieving of data from the database.
- When you click on the table, a default SQL statement will appear on the SQL statement box, which you may modify as per your need.
- You can add up to 10 SQL statements simultaneously to retrieve data from different tables.
STEP-3: pgSQL statements
- In our example, we will be creating a simple PHP application for our sales management. This PHP dashboard will contain a chart where users can find the sales stats and maintain the data about the products.
- Now, enter the pgSQL statement in text box in a following manner
SELECT strftime('%Y-%m',o.shippeddate) as xaxis, sum(d.quantity) as yaxis from `order details` d, orders o where o.orderid = d.orderid group by strftime('%Y-%m',o.orderdate) limit 50
- Now, we want to execute our query and fetch the data from the tables. Click the Run Query button

- Query Result will appear. Now, we have to assign x-axis data to the x-axis column and y-axis data to the y-axis column. Select your x-axis data from the drop down list of X and y-axis data from the drop down list of Y .
- Click Save Changes
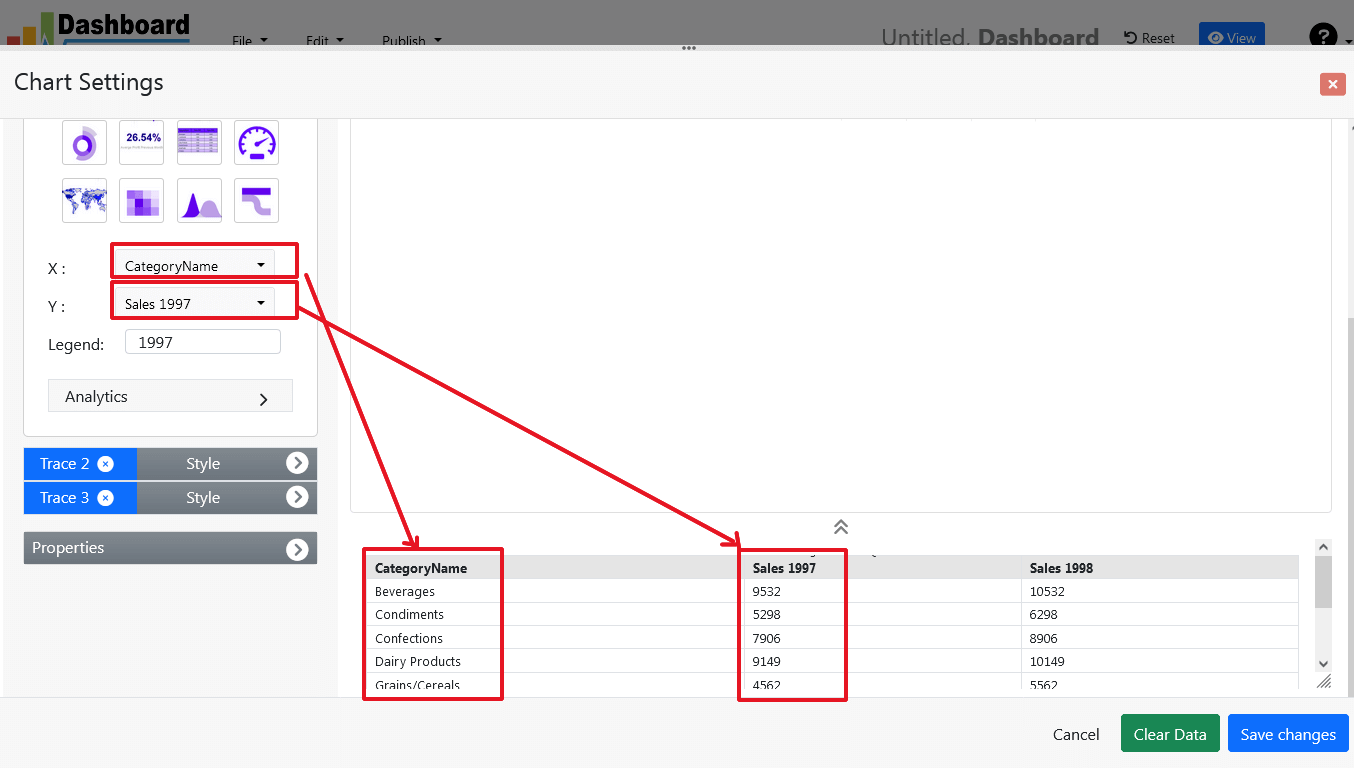
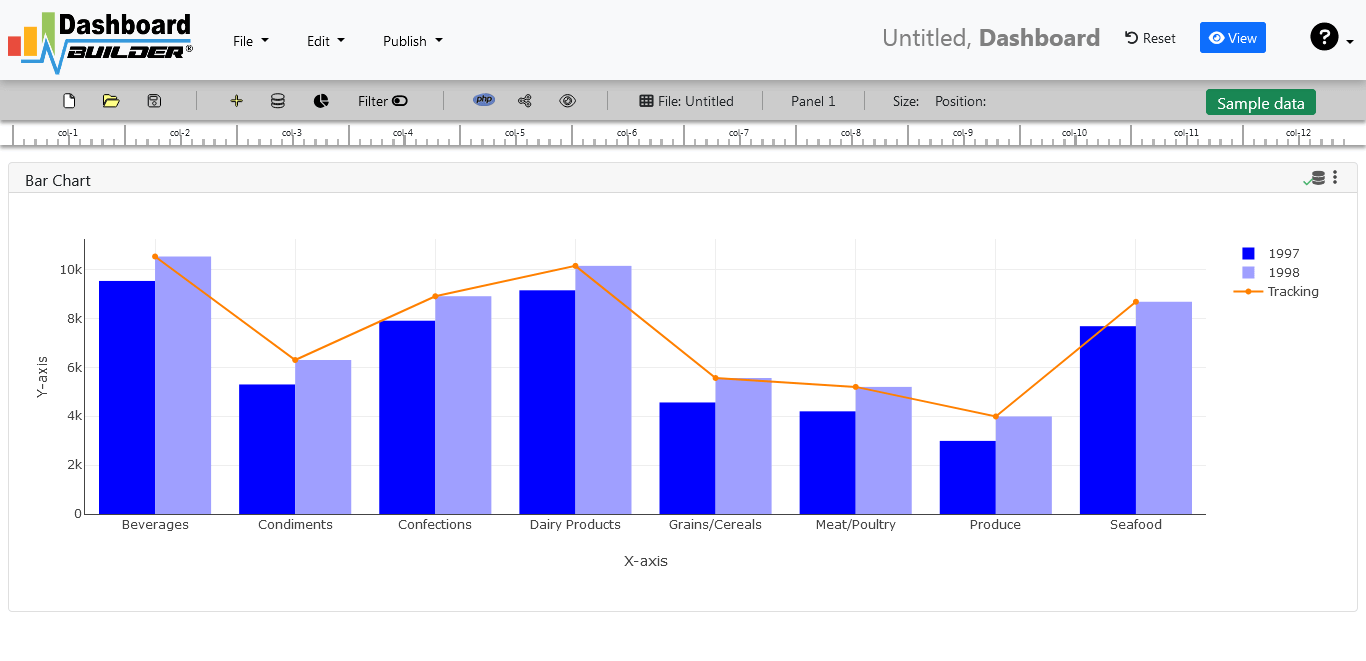
- Charts will be appeared on the screen as shown below.
STEP-4: Adjust the position
- You may adjust the size and the position of the Chart Panel by dragging its corner. The size and position are fully responsive according to the Bootstrap framework
STEP-5: Generate source code of the Dashboard for your Web Application
- So far we have successfully build our dashboard. In this step we are going to generate the source code we have just created. Click the Generate button to auto-generate PostgreSQL dashboard source code for our PHP application

- The source code for the dashboard will automatically generate, you may copy past this script of dashboard to your PHP application.
Open Source Code of the Dashboard Designer for Web Application
/**
 * DashboardBuilder
 *
 * @author Diginix Technologies www.diginixtech.com
 * Support  - http://www.dashboardbuilder.net
 * @copyright (C) 2018 Dashboardbuilder.net
 * @version 2.1.7
 * @license: license.txt
 */

include("inc/dashboard_dist.php");  // copy this file to inc folder


// for chart #1
$data = new dashboardbuilder();
$data->type =  "line";

$data->source =  "Database";
$data->rdbms =  "pgsql";
$data->servername =  "your-servername";
$data->username =  "userid";
$data->password =  "password";
$data->dbname =  "your-db-name";
$data->xaxisSQL[0]=  "SELECT strftime(^%Y-%m^,o.shippeddate) as xaxis, sum(d.quantity) as yaxis from `order details` d, orders o  where o.orderid = d.orderid group by strftime(^%Y-%m^,o.orderdate) limit 50";
$data->xaxisCol[0]=  "xaxis";
$data->yaxisSQL[0]=  "SELECT strftime(^%Y-%m^,o.shippeddate) as xaxis, sum(d.quantity) as yaxis from `order details` d, orders o  where o.orderid = d.orderid group by strftime(^%Y-%m^,o.orderdate) limit 50";
$data->yaxisCol[0]=  "yaxis";
$data->name = "linechart";
$data->title = "Line Chart";
$data->orientation = "";
$data->xaxistitle = "x-axis title";
$data->yaxistitle = "y-axis title";
$result[0] = $data->result();

?>

<!DOCTYPE html>
<html>
<head>
	<script src="assets/js/dashboard.min.js"></script> <!-- copy this file to assets/js folder -->
	<!--<link rel="stylesheet" href="assets/css/bootstrap.min.css"> Bootstrap CSS file, change the path accordingly -->


</head>
<body>

<div class="container">
<div class="col-lg-12">
<div class="panel panel-default">
<div class="panel-heading"></div>
    <div class="panel-body">
        <?php echo $result[0];?>
    </div>
</div>
</div>
</div>
</body>
Conclusion
In conclusion, the Dashboard Designer is a powerful tool that unlocks the potential of data visualization and analysis. This versatile tool empowers you to create visually stunning, interactive, and highly customizable dashboards. By leveraging the capabilities and resources available with the Dashboard Designer, you can transform raw data into valuable insights, foster a data-driven culture, and make informed decisions that drive business growth. Embrace the power of the Dashboard Designer and unleash the potential of data visualization in your organization.
How helpful was this information?
Prediction Analytics in Visualization: A Comprehensive Guide for Data-Driven Decision Making
Overview
Prediction analytics in visualization is a powerful approach that combines predictive analytics techniques with data visualization to gain valuable insights from complex datasets and forecast future trends. In today's data-driven world, businesses and organizations are constantly seeking ways to extract meaningful information from the vast amount of data at their disposal. Prediction analytics in visualization plays a crucial role in helping them transform raw data into actionable intelligence, enabling data-driven decision-making and strategic planning.

Introduction
In today's era of data abundance, organizations are sitting on a goldmine of information. However, the real challenge lies in transforming this raw data into actionable insights to make informed decisions. Prediction analytics in visualization is a powerful combination that enables businesses to unlock the hidden potential of their data and predict future trends. In this guide, we will explore the concepts of prediction analytics in visualization and provide a step-by-step approach on how to effectively use it for data-driven decision making.
I. Understanding Prediction Analytics in Visualization
Prediction analytics, also known as predictive analytics, is the use of statistical algorithms and machine learning techniques to analyze historical data and make predictions about future events. It involves identifying patterns, relationships, and trends within data to forecast outcomes. Visualization, on the other hand, employs charts, graphs, and interactive dashboards to represent complex data visually. Combining prediction analytics with visualization enhances the comprehension of analytical results and aids in decision-making processes.
II. The Benefits of Prediction Analytics in Visualization
- Clear Insights: Visualization makes complex data more accessible and understandable, allowing decision-makers to quickly grasp key insights without getting lost in technical jargon.
- Proactive Decision Making: Predictive analytics empowers businesses to anticipate future trends, identify potential risks, and take proactive measures to stay ahead of the competition.
- Optimal Resource Allocation: Visualization of predictive models enables efficient allocation of resources, optimizing budget allocation, workforce planning, and inventory management.
- Personalization and Customer Engagement: By predicting customer behavior and preferences, businesses can tailor their products and services to meet individual needs, enhancing customer engagement and loyalty.
III. How to Use Prediction Analytics in Visualization
Step 1: Define the Objective
- Clearly articulate the problem or question you want to answer using prediction analytics. Whether it's forecasting sales, predicting customer churn, or optimizing inventory, a well-defined objective is crucial.
Step 2: Data Collection and Preparation
- Gather relevant data from various sources and ensure its quality, accuracy, and completeness.
- Preprocess the data by handling missing values, normalizing or scaling, and converting it into a format suitable for analysis.
Step 3: Choose the Right Model
- Select appropriate predictive algorithms based on your specific use case. Predictive modeling involves giving the presence of particular variables in a large dataset a certain weight or score. This score is then used to calculate the probability of a certain event occurring in the future. For this reason, the dashboard builder uses regression modeling approaches in predictive analytics.
Step 4: Model Training and Validation
- Split your data into training and validation sets to train the predictive model and test its accuracy.
- Use techniques like cross-validation to ensure the model's reliability and prevent overfitting.
Step 5: Apply Visualization Techniques
- Utilize data visualization tools like the Dashboard Builder to present the results of your predictive model in a visually compelling manner.
- Create interactive dashboards, charts, and graphs to display trends and insights that support your decision-making process.
Step 6: Interpretation and Decision Making
- Interpret the visualizations carefully, considering the implications of the predictions on your business objectives.
- Use these insights to make well-informed decisions and develop strategies to capitalize on opportunities and mitigate risks.
Step 7: Monitor and Refine
- Continuously monitor the performance of your predictive model and update it as new data becomes available.
- Refine your visualization techniques based on feedback and changing business needs.
IV. Best Practices and Challenges
Best Practices:
- Ensure data quality and integrity throughout the entire process to obtain accurate predictions..
- Collaborate with domain experts to understand the nuances of the business problem and validate model outputs..
- Keep visualizations simple, intuitive, and relevant to the audience..
Challenges:
- Dealing with large and complex datasets that may require powerful computing resources.
- Addressing potential biases in the data and models to ensure fair and ethical predictions.
- Managing data security and privacy concerns, especially when dealing with sensitive information.
Conclusion
Prediction analytics in visualization empowers you to make data-driven decisions, gaining valuable insights into future trends and outcomes. By following the step-by-step guide outlined in this article, you can harness the power of predictive models and data visualization tools to unlock the true potential of their data. It's crucial to remember that successful implementation requires a combination of technical expertise, domain knowledge, and a commitment to continuous improvement. Embrace prediction analytics in visualization as a strategic asset that guides your business toward growth and success in an increasingly competitive landscape.
How helpful was this information?
Dashboard Software FREE download
Unlocking Success with Dashboard Software: A Comprehensive Guide to Visualization and Analysis Data with Dashboard-Software
Dashboard software is a digital tool that enables users to create, customize, and interact with visual representations of data, usually in the form of charts, graphs, and other visual elements. These dashboards provide a consolidated view of data, making it easier for individuals and teams to monitor key performance indicators (KPIs), track progress, and make informed decisions. Dashboard software often connects to various data sources, including databases, spreadsheets, APIs, and cloud services, to aggregate and dashboard display data in real-time or at scheduled intervals.

What is Dashboard Software?
Dashboard software is a game-changer in today's data-driven world. Businesses and organizations collect massive amounts of data on a daily basis. They require effective tools to visualize and analyze data in order to make informed decisions and gain insights. In this regard, dashboard-software plays a vital role. It enables users to turn raw data into meaningful, actionable insights, resulting in improved decision-making and overall efficiency. In this blog, we'll look at what dashboard software is, its key features, benefits, popular use cases, and important factors to consider when choosing the right solution.
Key Features of Dashboard Software
- Data Visualization: Dashboard software offers a wide range of visualization options, such as bar charts, pie charts, line graphs, heatmaps, and more. Users can choose the most suitable visual representation for their data.
- Real-Time Data: Many dashboard tools allow users to connect to live data sources, ensuring that the displayed information is always up-to-date.
- Customization: Users can personalize their dashboards by selecting color schemes, adding logos, and arranging widgets to suit their preferences and branding.
- Interactivity: Interactivity is a crucial feature. Users can click on elements in the dashboard to filter data or drill down into more detailed information.
- Data Integration: The ability to connect to various data sources, including databases, spreadsheets, cloud applications, and web services, is essential for comprehensive data analysis.
- Alerts and Notifications: Many dashboard solutions offer the capability to set up alerts based on predefined conditions, helping users stay informed when specific thresholds are met or exceeded.
- Mobile Responsiveness: Dashboards should be accessible on mobile devices, ensuring that users can access critical information on the go.
- Security and Access Control: Robust security features are necessary to protect sensitive data. Role-based access control allows administrators to define who can view and edit specific dashboards.
Benefits of Dashboard Software
- Improved Decision-Making: Dashboards provide a clear and concise view of data, enabling faster, data-driven decision-making.
- Efficiency: By consolidating data from various sources, dashboard software saves time and effort in data gathering and analysis.
- Visibility: Dashboards offer transparency, allowing teams to monitor progress and performance in real-time.
- Productivity: With data readily available, teams can focus on tasks that matter most, rather than sifting through data manually.
- Early Issue Detection: Real-time data and alerts help in identifying issues or opportunities as soon as they arise.
- Enhanced Collaboration: Dashboards can be shared with team members, fostering collaboration and alignment around common goals.
Popular Use Cases for Dashboard Software
- Business Analytics: Companies use dashboards to track financial metrics, sales performance, customer satisfaction, and operational efficiency.
- Marketing Metrics: Marketers use dashboards to monitor website traffic, conversion rates, social media engagement, and email campaign performance.
- IT Operations: IT teams can create dashboards to monitor server uptime, network performance, and security threats.
- Healthcare: Hospitals and medical facilities utilize dashboards to monitor patient data, resource allocation, and emergency room occupancy.
- Education: Educational institutions use dashboards to track student progress, attendance, and resource utilization.
- Finance and Investments: Investors use dashboard-software to monitor stock portfolios, track market trends, and analyze investment data.
Considerations for Selecting Dashboard Software
- Data Sources: Ensure the software supports data sources relevant to your organization.
- Ease of Use: Choose a tool that is user-friendly, as complex software may hinder adoption.
- Scalability: Select a solution that can grow with your business and accommodate increasing data volume.
- Cost: Consider your budget and pricing model, whether it's a one-time purchase, subscription-based, or open source.
- Integration: Ensure the software can integrate with your existing systems and applications.
- Security: Evaluate the security features, including data encryption, user access control, and compliance with data protection regulations.
- Support and Training: Assess the availability of support and training resources to help your team get the most out of the software.
- Customization: Look for a tool that allows you to customize dashboards to meet your specific needs.
What software is used for dashboards?
There are numerous software options available for creating dashboards, catering to a wide range of users, from individuals to large enterprises. The choice of dashboard display software depends on your specific needs, budget, and technical expertise.
When selecting dashboard software, consider factors such as your data sources, the level of customization required, user-friendliness, scalability, and budget. Many of these tools offer dashboard software free trials or free versions, which can help you determine which one best suits your needs before making a commitment.
Which tool is best for dashboard?
Determining the "best" dashboard tool depends on your specific requirements, such as your data sources, level of technical expertise, budget, and the complexity of your dashboard projects. The Dashboard Builder is the only dashboard software that one-size-fits-all answer, and that works best for all and the ideal choice for organizations.
How do I create a dashboard software?
APPLIES TO: On-premises Online Desktop

Creating dashboard software is a significant undertaking, and the complexity of the project may vary based on your specific goals and resources. It's essential to continuously gather feedback from users and iterate on your software to meet evolving needs and expectations. Additionally, consider open-source development, as building a community around your software can be valuable in terms of contributions, support, and adoption.
Creating a dashboard software using a dashboard builder is a more streamlined and user-friendly process compared to building it from scratch. Dashboard builder is a software tool that provides a user interface for creating dashboards with pre-built components and templates. Here's a step-by-step guide on how to create a dashboard using a dashboard builder:
Requirements:
- PHP Version 7.2 or later
- Apache 2 or later
- Windows 7 or later / Linux 3 or later
- Compatible browsers: Firefox 52, Chrome 57, IE 8
Installation:
- Download the Dashboard Builder from the provided source.
- Place the downloaded file in a directory on your web server (e.g., .../www/dashboardbuilder/).
- Unzip the downloaded zip file into the root folder of "dashboardbuilder."
Step 1: Connect to the MySQL Database
- Open your web folder in the browser at "http://localhost/dashboardbuilder."
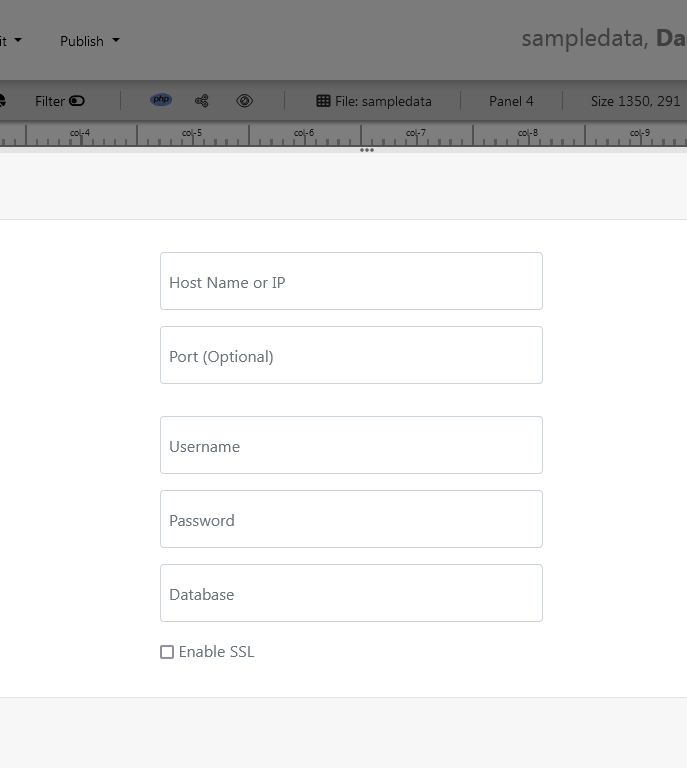
- Click on the Database icon in the Dashboard Software welcome screen.
- Select the MySQL database as the data source.
- Enter the database credentials.
- Save the changes.

Step 2: Launch the Chart Settings Panel
- After successfully connecting to the database, select the chart settings option.

Step-3: Retrieve data from the database

- A list of tables will appear. Click on a table to select it.
- A default SQL statement will be shown, which you can modify as needed.
- You can use up to ten SQL statements simultaneously.
- Enter an SQL query for your dashboard. For example, you can use this SQL query:
- Click the "Run Query" button to execute the SQL query.
SELECT strftime('%Y-%m',o.shippeddate) as xaxis, sum(d.quantity) as yaxis from `order details` d, orders o where o.orderid = d.orderid group by strftime('%Y-%m',o.orderdate) limit 50
Step 4: Select the X and Y Axes

- The query result will be displayed.
- Assign data from the x-axis to the x-axis column and data from the y-axis to the y-axis column.
- Choose your x-axis data from the X dropdown list and your y-axis data from the Y dropdown list.
- Click the "Save Changes" button.
Step 5: Generate PHP Source Code for your Dashboard Software

- To generate the PHP dashboard source code for your dashboard software, click the "Create PHP code" button.
- The dashboard software source code for the dashboard will be automatically generated.
- Copy and paste this dashboard software script into your web application.
/**
 * DashboardBuilder
 *
 * @author Diginix Technologies www.diginixtech.com
 * Support  - http://www.dashboardbuilder.net
 * @copyright (C) 2018 Dashboardbuilder.net
 * @version 2.1.7
 * @license: license.txt
 */

include("inc/dashboard_dist.php");  // copy this file to inc folder


// for chart #1
$data = new dashboardbuilder();
$data->type =  "pie";

$data->source =  "Database";
$data->rdbms =  "mysql";
$data->servername =  "";
$data->username =  "";
$data->password =  "";
$data->dbname =  "northwind";
$data->xaxisSQL[0]=  "SELECT strftime(^%Y-%m^,o.shippeddate) as xaxis, sum(d.quantity) as yaxis from `order details` d, orders o  where o.orderid = d.orderid group by strftime(^%Y-%m^,o.orderdate) limit 50";
$data->xaxisCol[0]=  "xaxis";
$data->yaxisSQL[0]=  "SELECT strftime(^%Y-%m^,o.shippeddate) as xaxis, sum(d.quantity) as yaxis from `order details` d, orders o  where o.orderid = d.orderid group by strftime(^%Y-%m^,o.orderdate) limit 50";
$data->yaxisCol[0]=  "yaxis";
$data->name = "piechart";
$data->title = "Pie Chart";
$data->orientation = "";
$data->xaxistitle = "x-axis title";
$data->yaxistitle = "y-axis title";
$result[0] = $data->result();

?>

<!DOCTYPE html>
<html>
<head>
	<script src="assets/js/dashboard.min.js"></script> <!-- copy this file to assets/js folder -->
	<!--<link rel="stylesheet" href="assets/css/bootstrap.min.css"> Bootstrap CSS file, change the path accordingly -->


</head>
<body>

<div class="container">
<div class="col-lg-12">
<div class="panel panel-default">
<div class="panel-heading"></div>
    <div class="panel-body">
        <?php echo $result[0];?>
    </div>
</div>
</div>
</div>
</body>
The provided instructions walk you through creating a dynamic dashboard software in PHP with a MySQL database connection. It's essential to have some knowledge of SQL queries and PHP development to follow these steps effectively. This process allows you to create a customized dashboard that retrieves and displays data from your database, making it a valuable tool for data analysis and visualization.
Conclusion
Dashboard software is a powerful tool for businesses and organizations seeking to gain insights from their data. By providing a visual, real-time view of key metrics and performance indicators, dashboard software streamlines decision-making, enhances efficiency, and fosters collaboration. Selecting the right dashboard software requires careful consideration of features, use cases, and integration capabilities. With the right solution in place, you can unlock the full potential of your data and drive success in today's data-driven world.
Are you ready to try your hand at Dashboard Software ? Try Dashboard Software!
What is Data Visualization? Exploring Definition, Examples, Procedure, Techniques, and Elements
Mastering Data Visualization: From Insights to Impactful Visuals
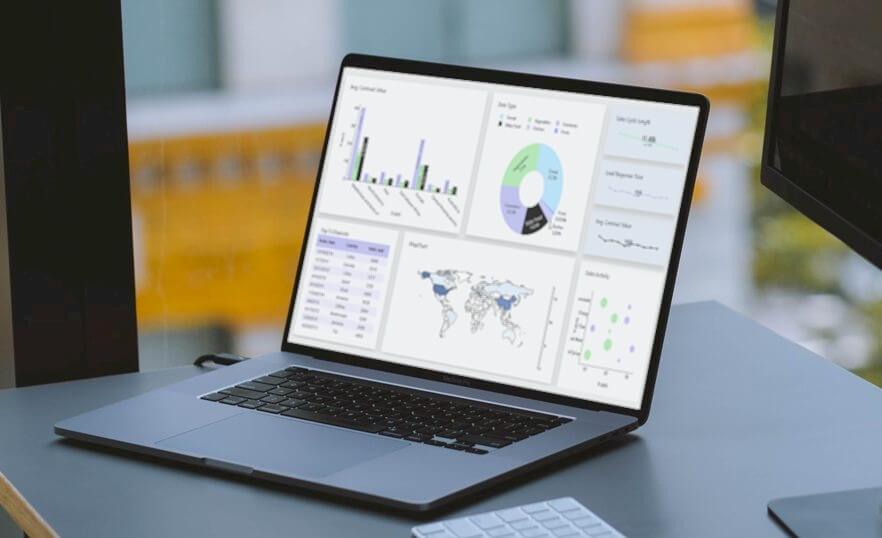
In today's data-driven world, the ability to interpret and communicate complex information effectively is paramount. This is where data visualization steps in as a powerful tool. Data visualization is the art and science of representing data through visual and graphical means to uncover insights, patterns, and trends that might be difficult to discern in raw data alone. By transforming data into visual representations, it becomes easier for both experts and non-experts to comprehend and make informed decisions based on the information presented.
Data Visualization Definition
Data visualization refers to the practice of representing complex sets of data and information through visual and graphical means, enabling individuals to grasp patterns, relationships, and insights that might be concealed within raw data. By using visual elements such as charts, graphs, maps, and diagrams, data visualization transforms intricate data points into accessible and understandable formats, facilitating effective communication, analysis, and decision-making.
Overview of Data Visualization
Data visualization is the art and science of translating intricate data sets into visual formats that transcend the limitations of traditional numerical presentations. By harnessing the potential of charts, graphs, maps, and other visual elements, data visualization encapsulates the power to unveil hidden trends, correlations, and insights that might otherwise remain obscured in spreadsheets and databases.
Importance of Data Visualization Tools
Data visualization tools hold immense importance in converting raw data into meaningful insights, rendering intricate information more comprehensible, and enabling actionable outcomes. They visually represent data, facilitating the identification of hidden patterns, trends, correlations, and anomalies that might remain obscured within raw data. In the contemporary era of data reliance, the significance of data visualization tools cannot be overstated, as they empower informed decision-making and effective communication of information.
Purpose and Benefits of Data Visualization Tools
Importance: Data visualization tools play a crucial role in transforming raw data into meaningful insights, making complex information more accessible, understandable, and actionable. They provide a visual representation of data, allowing individuals and organizations to identify patterns, trends, correlations, and outliers that might not be apparent in raw data alone. In today's data-driven world, the importance of data visualization tools cannot be overstated, as they facilitate informed decision-making and effective communication of information.
Purpose:
- Understanding Data: Data visualization tools help users comprehend data more effortlessly by transforming numbers and statistics into visual elements like graphs, charts, and maps. These visuals make it simpler to grasp the context and relationships within the data.
- Identifying Patterns and Trends: Visualizations empower users to identify patterns and trends in data, such as seasonal variations, growth trends, and cyclical patterns. This aids in making predictions, identifying opportunities, and mitigating risks.
- Exploring Relationships: Data visualization tools enable users to explore relationships between variables. Scatter plots, heat maps, and network diagrams help reveal connections, correlations, and dependencies among different data points.
- Detecting Anomalies: Visualization tools can highlight anomalies, outliers, and unexpected deviations in data, which might be indicative of errors or exceptional events. Detecting these anomalies is crucial for data quality control and decision-making.
- Comparing Data: Visualizations facilitate effortless comparison of different datasets or variables. Bar charts, pie charts, and histograms enable quick analysis of proportions, distributions, and variations between categories.
- Communicating Insights: Visual representations are often more compelling and memorable than raw data. Data visualization tools help in communicating insights and findings to a broader audience, including stakeholders, team members, and clients.
Benefits:
Data visualization tools offer a multitude of benefits, ranging from improved understanding and decision-making to effective communication and collaboration, ultimately leading to enhanced business outcomes and strategic insights.
- Clear Insights: Data visualization tools transform complex data into visual representations, making it easier to understand and interpret intricate patterns, trends, and relationships.
- Enhanced Decision-Making: Data visualizations enable quicker identification of trends, anomalies, and key insights, leading to informed and data-driven decision-making.
- Efficient Communication:Data visualizations simplify the communication of data-driven insights to both technical and non-technical audiences, facilitating a shared understanding of information.
- Pattern Recognition: Data visualization tools help users detect hidden patterns, correlations, and outliers that might not be apparent in tabular data, aiding in identifying opportunities and risks.
- Interactive Exploration: Many data visualization tools offer interactive features that allow users to explore data from different angles, facilitating deeper exploration and understanding.
- Data Storytelling: Data Visualizations facilitate the creation of compelling narratives around data, making it more engaging and memorable for conveying insights to stakeholders.
- Real-Time Monitoring: Real-time data visualizations provide immediate insights into ongoing processes, enabling timely responses and proactive interventions.
- Collaboration and Engagement: Data visualizations promote collaboration by enabling teams to work together on analyzing and interpreting data, fostering data-driven discussions.
- Quick Problem-Solving: Data visualizations help users identify bottlenecks, inefficiencies, and areas for improvement, enabling rapid problem-solving and optimization.
- Effective Planning: By visualizing historical data and trends, organizations can make accurate forecasts and strategic plans for future endeavors.
- Data Quality Assurance: Data visualization tools assist in identifying data errors, outliers, and inconsistencies, contributing to maintaining high data quality standards.
- Increased Engagement: Data visualizations captivate audiences and enhance engagement in presentations, reports, and dashboards, increasing the impact of communicated insights.
- Customization: Data visualization tools allow users to tailor visualizations to their specific needs, creating visuals that best represent the data's significance.
- Visual Exploration of Big Data: Data visualizations simplify the comprehension of large and complex datasets, aiding in identifying meaningful insights without getting lost in the data volume.
- Holistic View: Data visualizations provide a comprehensive view of data, enabling users to see the bigger picture and make strategic decisions based on a broad perspective.
- Track Progress: Data visualizations help track progress toward goals, KPIs, and targets over time, enabling organizations to adjust strategies as needed.
- Efficient Reporting: Data visualizations reduce the need for lengthy textual explanations, making reports more concise and reader-friendly while maintaining information depth.
- Predictive Analytics: Data visualizations combined with predictive models allow organizations to anticipate future trends and outcomes based on historical data.
- Increased ROI: Data visualization tools enable businesses to make better use of their data resources, leading to more efficient operations and higher returns on investments.
- Data Transparency: Data visualizations make data transparent and accessible to various stakeholders, fostering trust and accountability in decision-making processes.
Examples of Data Visualization

Data visualization takes many forms, from simple bar charts to intricate interactive dashboards. Some common examples include:
- Line Graphs: These show trends over time, making them useful for visualizing changes or patterns in data sequences.
- Bar Chart: A graphical depiction where data is represented by vertical or horizontal bars, indicating the value or frequency of different categories.
- Area Chart: A visual representation that portrays quantitative data as filled areas beneath a line, conveying the cumulative value of different categories over a continuous interval.
- Pie Chart: A visual representation that displays data as segments of a circular pie, showcasing the proportion of each category in relation to the whole.
- Scatter Plots: These display the relationship between two variables, helping to identify correlations and outliers.
- Histograms: These depict the distribution of numerical data, illustrating frequency within certain ranges.
- Heatmaps: These represent data values with colors on a grid, effectively showing the distribution and intensity of values.
- Maps and Geospatial Visualizations: These use geographical maps to display data related to specific locations, aiding in spatial analysis.
5 Important Steps for Effective Data Visualization
The process of effective data visualization involves a series of deliberate steps. These steps guide you from defining your goals to producing a polished data visualization that effectively communicates insights It commences with a clear understanding of the visualization's objective and the intended audience. Selecting the appropriate visualization format follows, ensuring that it resonates with the nature of the data and the insights sought. Data preparation and organization are paramount, as clean and accurate data is the bedrock of any successful visualization.
By adhering to the following 5 steps, you can create impactful data visualizations.
- Define the Objective and Audience: Clearly establish the purpose of your data visualization. Understand what insights you want to extract from the data and who your target audience is. Different audiences may require different levels of detail and complexity in the visualizations.
- Select the Right Visualization Type: Choose the most suitable visualization format based on the nature of your data and your objectives. Common types include bar charts, line graphs, scatter plots, pie charts, and maps. The chosen visualization should effectively communicate the relationships, patterns, and trends you aim to convey.
- Prepare and Organize the Data: Ensure your data is accurate, clean, and well-organized. This might involve data cleaning, transformation, and aggregation. Data quality significantly impacts the accuracy and credibility of your visualization.
- Design the Visualization: Pay careful attention to the design elements of your visualization. Choose appropriate colors, labels, titles, and fonts. The design should be intuitive and visually appealing while focusing on clarity and avoiding clutter. Highlight key points and relationships that align with your objectives.
- Create and Refine the Visualization: Utilize tools such as data visualization software, programming libraries, or even manual design to create the visualization. Once created, review and refine the visualization. Ensure that it effectively conveys the intended message, is easy to understand, and adheres to best practices.
Data Visualization Techniques
Several techniques enhance the effectiveness of data visualization:
- Color Coding: Proper use of colors can highlight patterns, relationships, and differences. However, excessive or inappropriate use can confuse the viewer.
- Interactivity: Interactive visualizations allow users to explore data on their terms, revealing insights at their own pace.
- Animations: Animations can show changes over time, aiding in understanding dynamic processes.
- Storytelling: Crafting a narrative around the visualization guides viewers through the data, making it more engaging.
- Hierarchy and Layout: Arrange visual elements strategically to emphasize important information and guide the viewer's focus.
- Data Aggregation: Summarizing large datasets into smaller groups or categories can simplify complex information.
Elements of Data Visualization
A well-designed data visualization comprises various essential elements:
- Title: Clearly states the purpose of the visualization.
- Axes and Labels: Clearly labeled axes and data points are crucial for proper interpretation.
- Legend: Explains the meaning of colors, symbols, or patterns used in the visualization.
- Data Points: Individual values or data markers that represent the information being displayed.
- Grid Lines: Assist in reading values and understanding the scale of the visualization.
- Scale: Indicates the range and intervals of values on the axes.
- Annotations: Explanatory notes, callouts, or additional information that provide context.
- Source: Cites the origin of the data, promoting transparency and credibility.
Conclusion
In conclusion, data visualization is an essential tool for transforming complex data into understandable and actionable insights. Through various techniques, thoughtful design, and appropriate choice of visualizations, data visualization empowers individuals and organizations to make informed decisions based on a deeper understanding of their data. Whether it's uncovering trends, identifying patterns, or communicating information effectively, data visualization plays a pivotal role in modern data analysis.
How helpful was this information?
Are you ready to try your hand at Data Visualization tool ? Try Data Visualization !
Chart Tool Essentials - Unleash the Potential of Chart Tools for Effective Data Presentation and Analysis
In today's data-driven world, the ability to present information effectively is a valuable skill. Whether you're a student, a professional, or simply someone who wants to visualize data, charts are a powerful tool. In this blog post, we'll explore the chart tool that you can download for free, understand the concept of charts and their uses, and discover the four common types of charts. We'll also help you find the best tools for creating charts online, and walk you through creating line graphs, bar charts, and XY graphs. Let's dive in!.
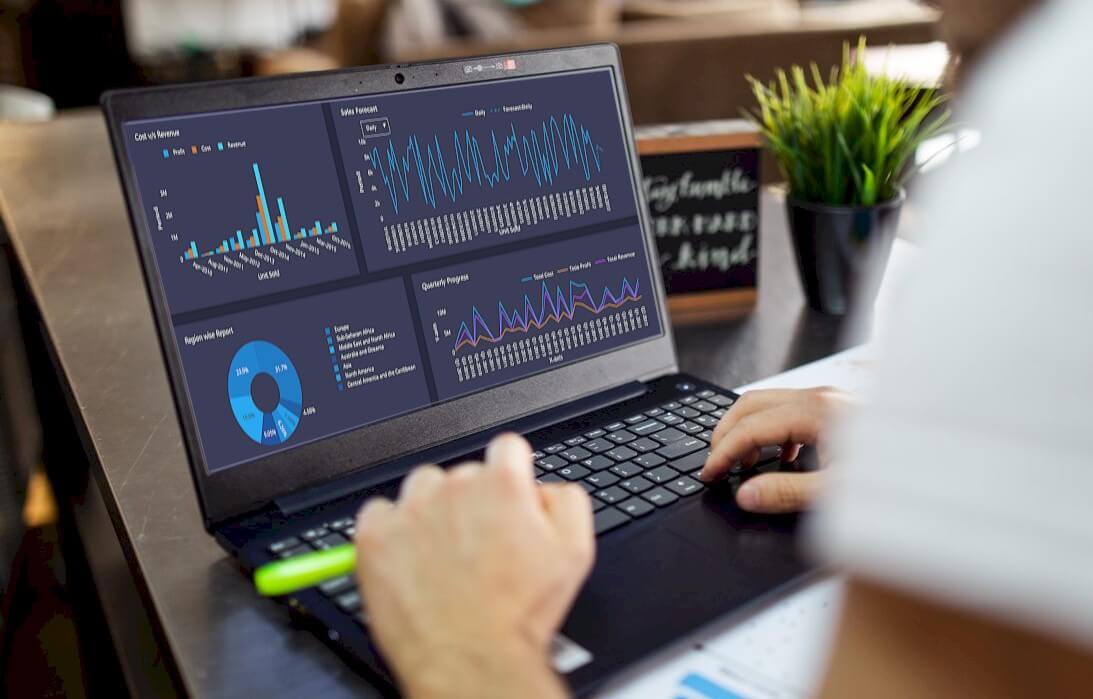
Overview
A chart tool, often referred to as charting software or a charting application, is a software program or online platform designed to create graphical representations of data in the form of charts, graphs, and visualizations. The Chart tool facilitates the transformation of numerical or categorical data into easily comprehensible and visually appealing formats. Users can input data, choose from various chart types, customize the appearance and content of the charts, and often add interactivity. Chart tool is commonly used for data analysis, data visualization, and data communication in a wide range of fields, including business, finance, education, science, and journalism, to convey insights, trends, and comparisons in a clear and concise manner.
If you're looking for professional chart creator that you can download for free, The Dashboard Builder is the great option available. Some of the popular benefits include:
Benefits of Using the Chart Tool:
- Data Clarity: Charts simplify complex data, making it easier to comprehend, identify trends, and draw insights. They help users see the bigger picture and the relationships within data.
- Effective Communication: Visual representations, such as charts, are more engaging and memorable than raw data. They are invaluable in presentations, reports, and academic projects.
- Informed Decision-Making: Charts enable data-driven decision-making by providing clear and relevant information. They help stakeholders understand the implications of data trends.
- Time Efficiency: Chart tools streamline the process of creating charts, saving time compared to manual charting methods.
- Accessibility: Many chart tools are user-friendly, making data visualization accessible to a wide range of users, regardless of technical expertise.
What is a Chart and Its Uses
A chart is a graphical representation of data that is used to make complex information more understandable and visually appealing. Charts are essential for various purposes, including:
- Data Analysis: Charts help in understanding patterns, trends, and relationships within data, making it easier to draw insights.
- Presentation: Charts are a powerful visual aid in presentations, helping to convey information more effectively than raw data.
- Comparison: Charts enable comparisons between different data points, making it simpler to identify differences or similarities.
- Tracking Changes: Charts can show changes in data over time, such as stock price fluctuations, temperature variations, or sales trends.
- Decision-Making: Charts assist in making informed decisions based on data analysis and trends.
What Are the Four Types of Charts
There are four common types of charts, each suited to specific types of data and analytical goals:
- Line Chart: Line charts are ideal for showing trends and changes over time. They connect data points with lines, making it easy to visualize continuous data.
- Bar Chart: Bar charts are used to compare data across categories. They are effective for showing discrete data and highlighting differences between categories.
- Pie Chart: Pie charts represent parts of a whole and are suitable for displaying percentages or proportions of a single dataset.
- Scatter Plot: Scatter plots are used to display the relationship between two variables, making them ideal for identifying correlations or outliers.
Best Tools to Create Charts
While there are many tools to create charts, the best one depends on your specific needs and preferences. In essence, the best chart tools prioritize user-friendliness, enabling users to navigate the software effortlessly, from data input to chart customization. This characteristic ensures that the process of creating visually compelling charts is as straightforward and efficient as possible.

The Dashboard Builder stands out as the best chart tool due to its unique combination of user-friendliness, versatility, and powerful features. With an intuitive interface, users of all skill levels can effortlessly navigate through the software, creating professional-grade charts and dashboards without the need for extensive training. It offers a wide variety of chart types, ensuring that users can select the most suitable visualization for their data. The tool's customization capabilities are robust, allowing for the fine-tuning of charts to match specific requirements and brand aesthetics. Additionally, the Dashboard Builder prioritizes efficiency, saving users valuable time by simplifying data input and chart creation. Its versatility makes it equally appealing to businesses, educators, and researchers, catering to a diverse range of data visualization needs. Overall, the Dashboard Builder excels in making the process of chart creation accessible, efficient, and effective, making it the top choice for those seeking a comprehensive and user-centric charting solution. The following are the characteristics that distinguish the Dashboard Builder.
- User-Friendly Interface: The best chart tool is defined by their intuitive and user-friendly interfaces, making them accessible to individuals of all skill levels. Whether you're a novice or an experienced data analyst, chart tools are designed to be easy to navigate and understand.
- Seamless Data Input: Users can effortlessly input their data into the charting tool. The process is streamlined, allowing for data import from various sources, such as spreadsheets or external files. This minimizes the time and effort required to prepare data for visualization.
- Intuitive Chart Creation: Chart creation is straightforward, with clear and easy-to-follow steps. These tools guide users through the process of selecting chart types, adjusting data series, and setting up visual elements, ensuring a hassle-free experience.
- Customization Made Simple: The best chart tools offer customization features that are easy to grasp. Users can change colors, fonts, labels, and other visual elements without the need for advanced technical knowledge. This ensures that users can tailor their charts to meet their specific needs.
- Accessibility for All: Accessibility is a core principle, making these tools inclusive to a broad audience. They remove barriers, allowing individuals from various backgrounds and expertise levels to create professional-looking charts without a steep learning curve.
- Efficiency and Time Savings: The tool chart is designed with efficiency in mind, reducing the time and effort required to create charts. Users can focus on the data and its insights rather than getting bogged down in the technicalities of chart creation.
Where do you find the chart tools?
Chart tools are readily available in a variety of forms to suit different preferences and needs. You can find them in desktop applications like the Dashboard Builder for Windows desktop, which offers robust charting capabilities that you can install on your computer. Online platforms such as Online Dashboard Builder provides accessible web-based chart-making without the need for downloads. Data visualization libraries like the Dashboard Builder (as a PHP library) cater to developers and offer a high degree of customization for embedding interactive charts in web applications. Additionally, open-source alternatives such as Open Source Dashboard offers free and customizable options. The choice of where to find chart tools depends on your specific needs, familiarity with the software, and the level of customization and features required for your data visualization projects. Whether you prefer desktop applications, online platforms, or specialized software, there's a tool available to meet your requirements.
FREE Chart Tool Online
If you're looking for online chart tools for free charting tool to create charts for free, options like the Dashboard Builder online is excellent choice. It allows you to create and share charts online without the need for downloads or installations.
Conclusion
Chart tools are indispensable assets for anyone dealing with data, whether in a professional, academic, or personal context. They empower users to transform raw data into actionable insights, enhancing data analysis and communication. With a wide range of options available, users can select the free chart tool that best suits their needs, making data visualization an accessible and effective practice in the modern age.
 the file dashboard.zip using Extract Here option to the root folder of "dashboardbuilder"