
A chart builder is a visual tool that turns raw data from databases, spreadsheets, and PDFs into interactive charts and graphs. With Chart Builder, you can create colorful, interactive charts using a drag-and-drop interface and auto-generated PHP and HTML5 code—no coding or BI software required.
On this page
What is a Chart Builder?
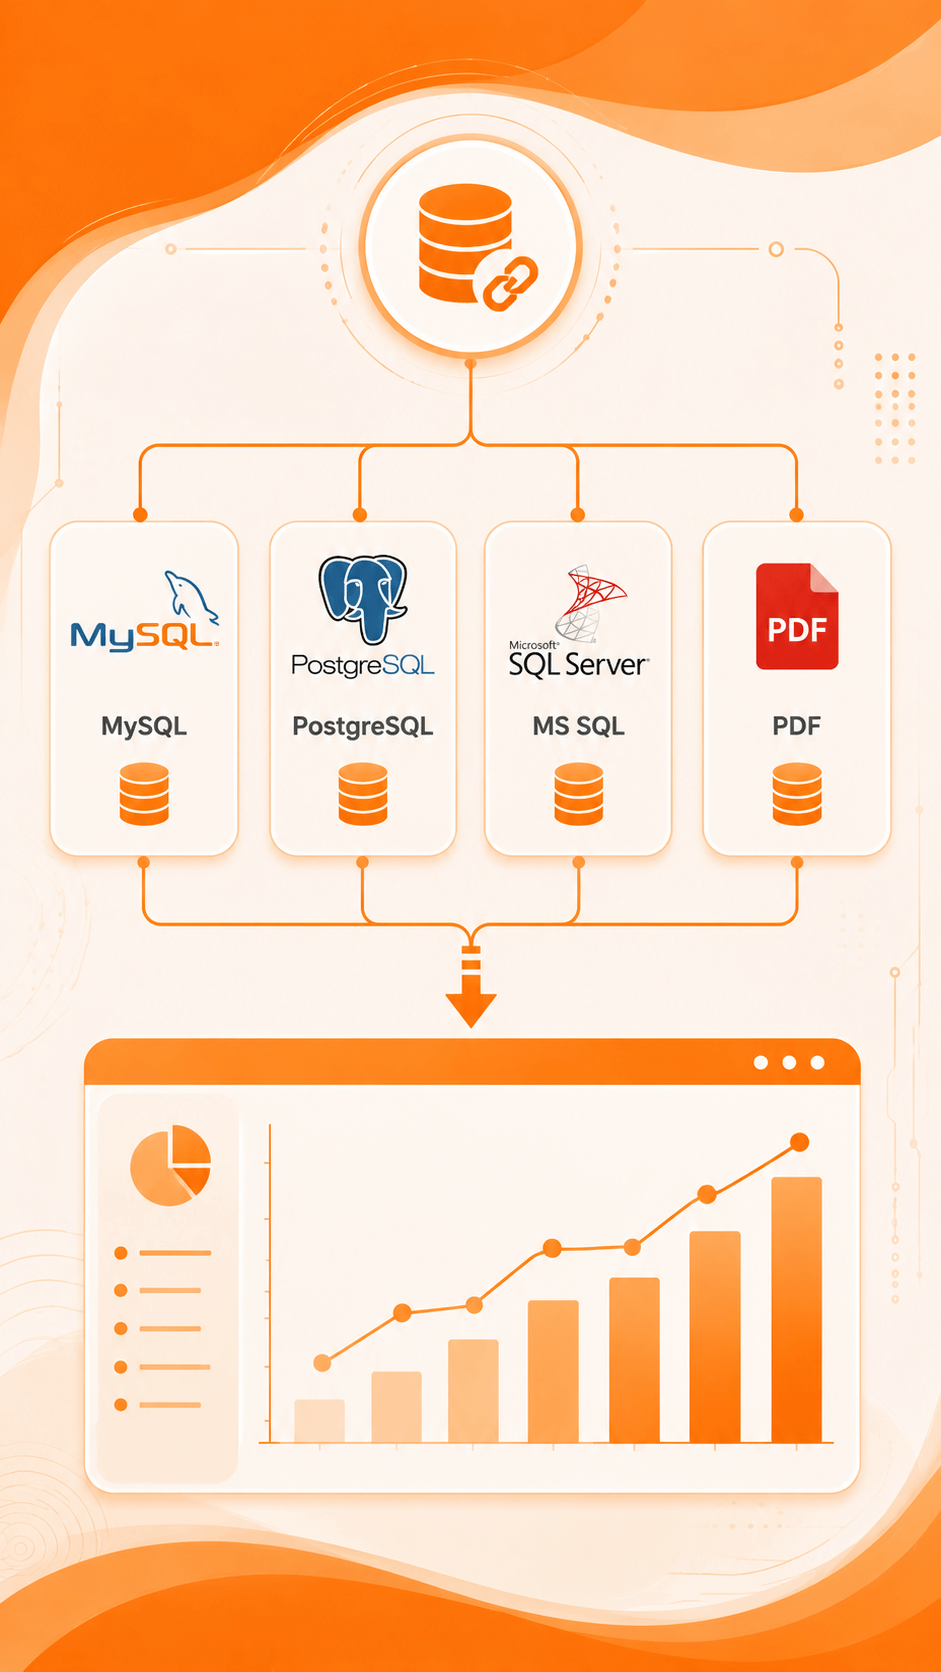
A chart builder is a front-end, browser-based tool that connects to your data—MySQL, PostgreSQL, Oracle, Excel, CSV, or PDF—and turns it into stunning, interactive charts. Chart Builder pairs a drag-and-drop interface with a built-in SQL query generator, so you can retrieve complex data and visualize it in minutes, without writing code or hiring technical help.

Why Visualize Your Data
Instead of scanning rows in a spreadsheet or scrolling through a database table, a well-built chart shows you the trend, the outlier, and the pattern at a glance. Chart Builder lets you pull data straight from your database or file, plot it on any of 40+ Interactive Chart types, and share the result as a link, an image, or embeddable code—so the same chart that helps you spot a problem can just as easily go in a report or on a dashboard.

How to Create a Chart (Step-by-Step)
Building a chart with Chart Builder comes down to five simple steps, from connecting your data to publishing the finished chart.
Connect your data source. Chart Builder supports MySQL, MS SQL, SQLite, PostgreSQL, Oracle, Sybase, Cubrid, Excel, JSON, CSV, Google Sheets, and PDF—so you can connect whatever you're already using.

Retrieve your data with the built-in SQL generator. Chart Builder auto-generates SQL statements for you in a few clicks—or write your own custom query if you need full control.

Choose your chart type. Pick from 140+ Interactive Chart types—line, bar, stacked bar, scatter, area, donut, bubble, gauge, heatmap, choropleth map, or sunburst—based on what best represents your data.

Assign data to the X and Y axis. Drag and drop your retrieved columns onto each axis, then resize and reposition the chart with the visual editor—no code required.

Publish and share. Generate a shareable link in one click, or export ready-to-use PHP/HTML5 code to embed the chart in PHP, WordPress, Joomla, Laravel, or any custom application.
Ready to build your first chart? Download Chart Builder for free to get started today.
Chart Builder Requirements
Chart Builder is a lightweight utility built in a simple, prescriptive way, so it doesn't need lavish server requirements to run.
Server Requirements
- PHP Version 7.2 or later
- Apache or Nginx
- Windows, Linux, or Ubuntu
Supported Browsers
- Firefox 52 or higher
- Chrome 57 or higher
- IE 8 or higher
To connect to your database and retrieve chart data, make sure your web server is configured to serve the folder containing Chart Builder, with read-write permission granted (chmod -R 777) to the Chart Builder folder and sub-folders. Check your browser console to confirm all Chart Builder files load without errors.
11 Popular Chart Types Supported
Chart Builder brings all the most widely used chart types together in one place, so you can trace and measure your data from every angle. Select any of the following from the chart type drop-down:

Line & Bar Charts
A line chart connects data points to show trends over time—the most common and widely used chart type. A bar chart compares categories using rectangular bars, plotted vertically or horizontally.
Stacked Bar & Scatter Charts
Stacked bar charts compare categories while breaking each one down into parts of a whole. Scatter charts plot two variables against each other using Cartesian coordinates to reveal correlation.
Area & Donut Charts
An area chart is a line chart with the space beneath it filled in color to emphasize volume. A donut chart is a pie chart variation with a hollow center, useful for showing an additional metric.
Bubble & Gauge Charts
A bubble chart is a scatter chart where bubble size represents a third data dimension. A gauge chart uses a needle on a dial—perfect for a speedometer-style KPI on a dashboard.
Heatmap & Choropleth Map
A heatmap visualizes a data matrix using color intensity. A choropleth map shades geographic regions according to a data variable—ideal for regional sales or performance comparisons.
Sunburst Chart
A sunburst chart displays hierarchical data as a series of nested rings, showing how each outer ring (child) relates back to the inner rings (parent categories).
Advantages of Using Chart Builder
1. No Coding Required
The drag-and-drop editor and built-in SQL generator mean you don't need programming skills or IT assistance to build a chart.

2. Connect Any Data
MySQL, PostgreSQL, Oracle, MS SQL, SQLite, Excel, CSV, Google Sheets, and PDF are all supported natively.
3. Embed Anywhere
Export clean PHP and HTML5 code and embed your chart in PHP, WordPress, Joomla, Laravel, or any custom web application.
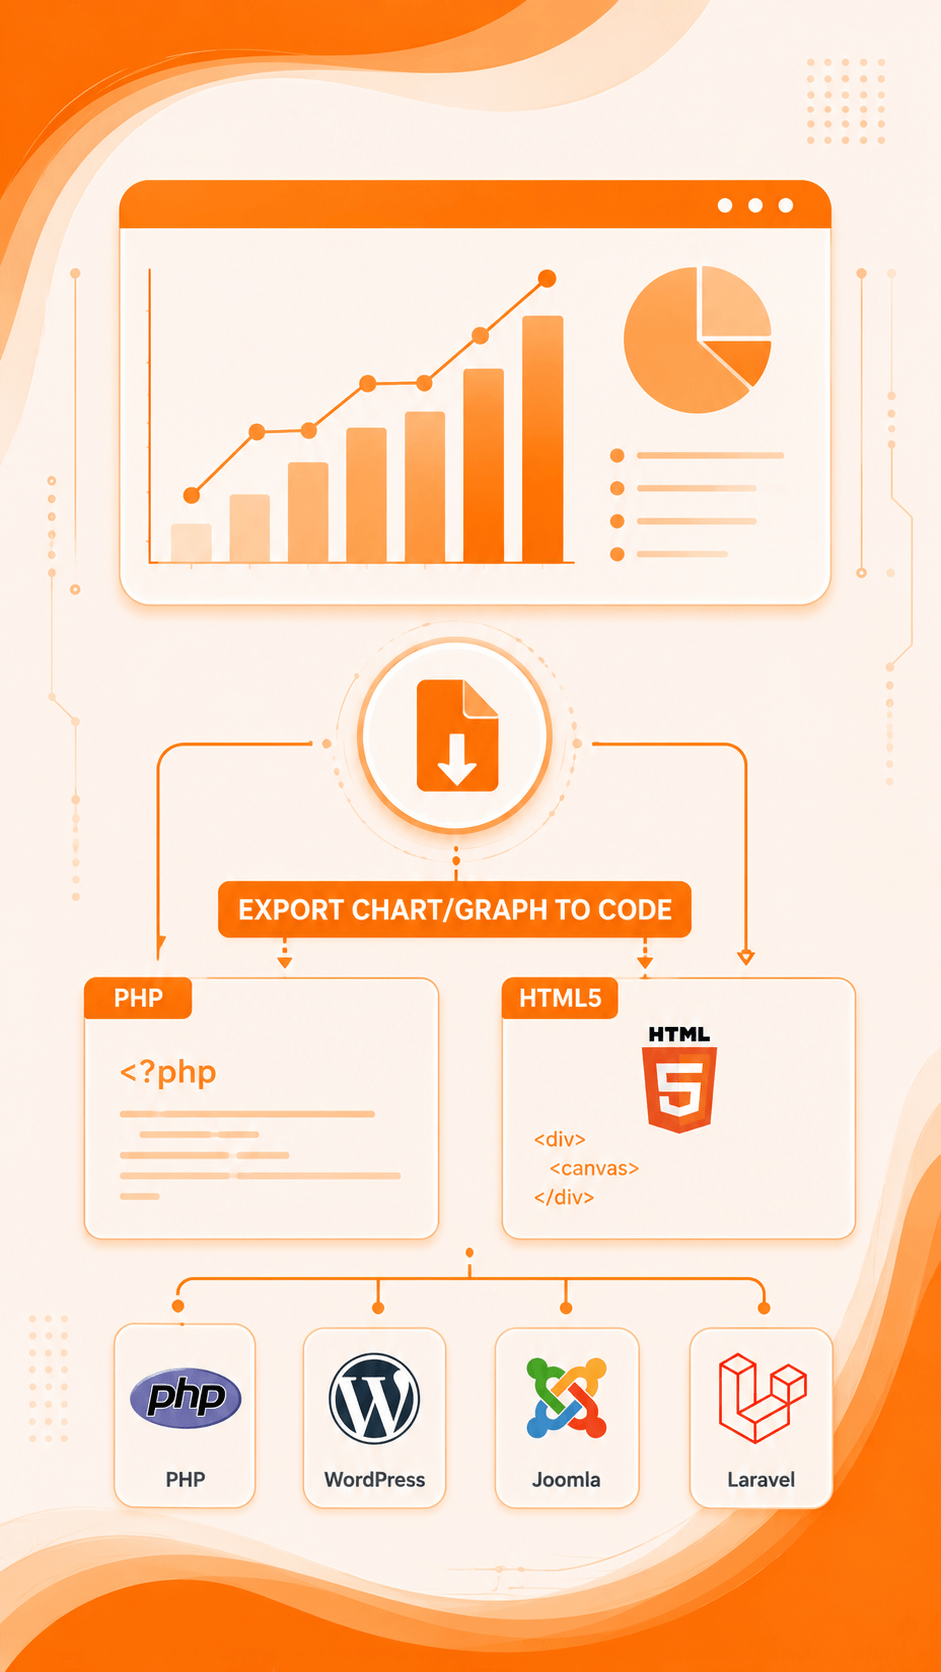
Chart Builder Best Practices
1. Match the Chart to the Data
Use line charts for trends, bar charts for comparisons, and gauge charts for single KPIs—don't force one chart type to do every job.
2. Keep Queries Focused
Use the SQL generator to pull only the columns you need for the X and Y axis, keeping charts fast and easy to read.
3. Test Before You Publish
Check your browser console for errors and confirm chart data loads correctly before sharing the link or embedding the code.
Publish and Share Your Charts
Publish and share your charts with a single click. Chart Builder generates a shareable URL for any chart you create, so your colleagues can view it instantly—no export or file transfer needed.
Chart Builder also generates ready-to-use PHP source code for every chart in one click. This auto-generated code is published under the MIT license, so you're free to customize it and embed it directly into your own PHP, WordPress, Joomla, or Laravel application.
Chart Builder Features
Chart Builder provides a full charting toolkit that runs directly on your own server environment: