A PHP dashboard is a data visualization tool built on PHP that generates ready-to-use PHP source code for your dashboard — no coding or PHP experience required. Dashboard Builder's PHP dashboard runs on Apache + PHP + MySQL + Bootstrap 5, with a D3.js charting engine and a drag-and-drop interface you can customize however you need.
What Is a PHP Dashboard?
A PHP dashboard is a data visualization tool built on the PHP framework that generates PHP source code for a dashboard without requiring any PHP coding or programming knowledge. It runs in any browser through a drag-and-drop interface, connecting to a database like MySQL to pull live data and render it as charts.
Under the hood, Dashboard Builder's PHP dashboard is a browser-based application built on Apache + PHP + MySQL + Bootstrap 5, with a D3.js charting engine. You connect your database once, and the tool generates PHP code that's adaptable and flexible with the latest jQuery and Bootstrap 5 framework — fully responsive out of the box, so a dashboard built this way renders well on phones, tablets, and desktops alike.
How to Build a PHP Dashboard (Step-by-Step)
Requirements: PHP 7.2+, Apache 2+, Windows 7+/Linux 3+, and a modern browser. Building a PHP dashboard comes down to five steps: connect your database, query your data, assign the X and Y axis, adjust the layout, and generate the PHP source code.
Connect to your database. Open the web folder in your browser (e.g. http://localhost/dashboardbuilder), click the Database icon, select MySQL (or your preferred database) from the data source tab, enter your credentials, and save. A green checkmark confirms the connection.
Enter your SQL query. Select the chart settings option to see a list of your database's tables. Click a table to load a default SQL statement, or write your own — for example: SELECT strftime('%Y-%m',o.shippeddate) as xaxis, sum(d.quantity) as yaxis from `order details` d, orders o where o.orderid = d.orderid group by strftime('%Y-%m',o.orderdate) limit 50. Click Run Query.
Select the X and Y axes. Once your query result appears, choose your X-axis field and Y-axis field from the dropdowns, then click Save Changes. Your chart renders on screen immediately.
Adjust the chart's size and position. Drag the corners of the chart panel to resize and reposition it — layout is fully responsive, built on Bootstrap 5.
Generate the PHP source code. Click Create PHP Code. The chart's PHP dashboard source code is generated automatically — copy and paste it directly into your PHP application.
Ready to build your own? Download the PHP Dashboard builder for free and get started today.
PHP Dashboard Template, Framework & Admin Panels
"PHP dashboard" covers a few different needs depending on what you're building, so here's how Dashboard Builder fits each one:
Supported Visualizations & Data Sources
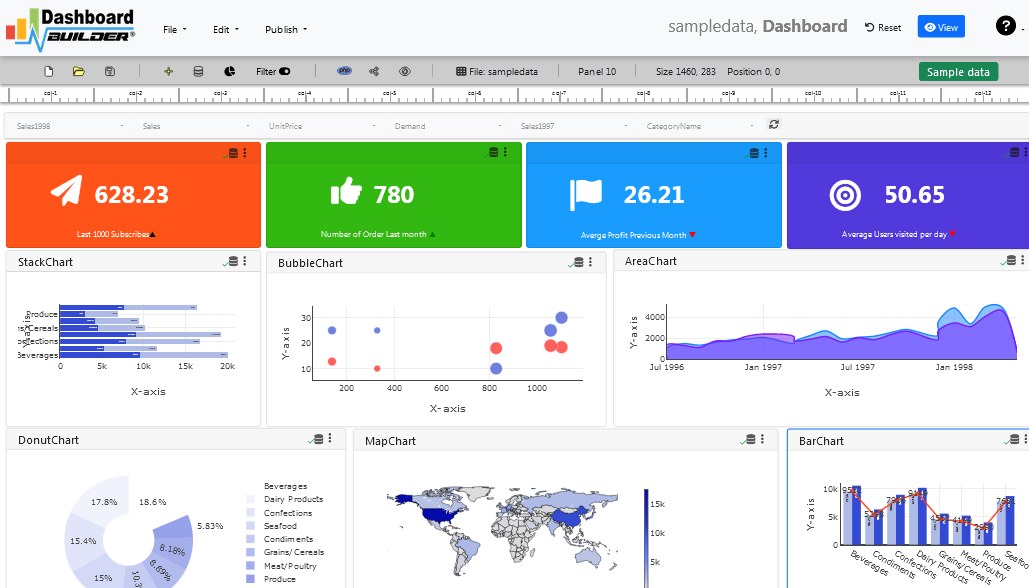
PHP Dashboard supports line, scatter, bar, pie, donut, bubble, stacked, area, heatmap, Sankey diagram, and choropleth map charts — all dynamic SVG graphics powered by D3.js. See a live example in the PHP Dashboard Example.
For data, it connects to MySQL, MS SQL, SQLite, Oracle, PostgreSQL, ODBC, Sybase, and Cubrid for static or real-time database-driven dashboards, and can also import directly from MS Excel and CSV files.
Requirements & Installation
PHP Dashboard can be installed on Windows, Linux, or any platform that supports Apache.
Server Requirements
- PHP Version 7.2 or later
- Apache 2 or later
- Windows 7 or later / Linux 3 or later
- Firefox 52, Chrome 57, or IE 8
Installation
- Download from Download Dashboard Builder.
- Place the files in a directory on your web server, e.g.
…/www/yoursite/dashboardbuilder-v3-FREE/. - Unzip using the Extract Here option into the root folder of "dashboardbuilder".
Before connecting your database, make sure your web server is configured to serve the folder, with read-write permission (chmod -R 644) granted to the folder and sub-folders. Check your browser console to confirm all files load without errors.
PHP Dashboard Source Code
Here's the auto-generated PHP source code for a simple line chart, released under the MIT license so you're free to customize it:
<?php
/**
 * DashboardBuilder
 * @author Diginix Technologies www.diginixtech.com
 * Support - http://www.dashboardbuilder.net
 * @copyright (C) 2016-22 Dashboardbuilder.net
 * @version 5.7
 * @license: MIT — see https://dashboardbuilder.net/code-license
 */
include("inc/dashboard_dist.php");  // copy this file to inc folder

// for chart #1
$data = new dashboardbuilder();
$data->type =  "line";
$data->source =  "Database";
$data->rdbms =  "sqlite";
$data->servername =  "";
$data->username =  "";
$data->password =  "";
$data->dbname =  "data\Northwind.db";
$data->xaxisCol[0] =  "xaxis";
$data->yaxisCol[0] =  "yaxis";
$data->name = "linechart";
$data->title = "Line Chart";
$data->xaxistitle = "x-axis title";
$data->yaxistitle = "y-axis title";
$result[0] = $data->result();
?>

<!DOCTYPE html>
<html>
<head>
	<script src="/assets/js/dashboard.min.js"></script>
</head>
<body>
<div class="card-default">
  <div class="card-heading">Line Chart</div>
  <div class="card-body">

  </div>
</div>
</body>
</html>
Full license details are on the code license page, and the open-source project is on GitHub.
Frequently Asked Questions
json_encode(), and pass that JSON into Highcharts' series configuration inside a script block. Note that Dashboard Builder's generated charts use a D3.js engine rather than Highcharts by default — if your project specifically requires Highcharts, you'd wire the PHP query output into Highcharts' own JS config using this same PHP-to-JSON pattern.