A chart maker turns a table of numbers into a clear, good-looking chart without you drawing it by hand. With Dashboard Builder’s free chart maker, you upload your data and AI does the work: it picks the chart types, labels and colors, and you can change anything you like before you download or share it.
How to Make a Chart in 4 Steps
Upload your data. Open the free AI Dashboard Generator and upload an Excel, CSV or PDF file with a table in it. No sign-up needed.
Let AI make the charts, or ask for one. In Auto mode, the AI builds a complete dashboard with 4 KPI cards and 6 charts. In Chat mode, type what you want, such as “Generate a pie chart to show age and income”.
Customize it. Change the chart type, colors, titles and labels until it looks right.
Download or share. Save it as an image, share a link, or generate code to embed it on your website. To keep editing later, sign up and save it to your control panel.
20+ Chart Types
Make bar, line, pie, donut, area, scatter, bubble, stacked bar, gauge, heatmap and map charts, plus KPI cards for single numbers. Not sure which to pick? Use a line chart for trends over time, a bar chart to compare categories, a pie or donut chart for parts of a whole (up to about 5 slices), and a scatter chart to show how two values relate.
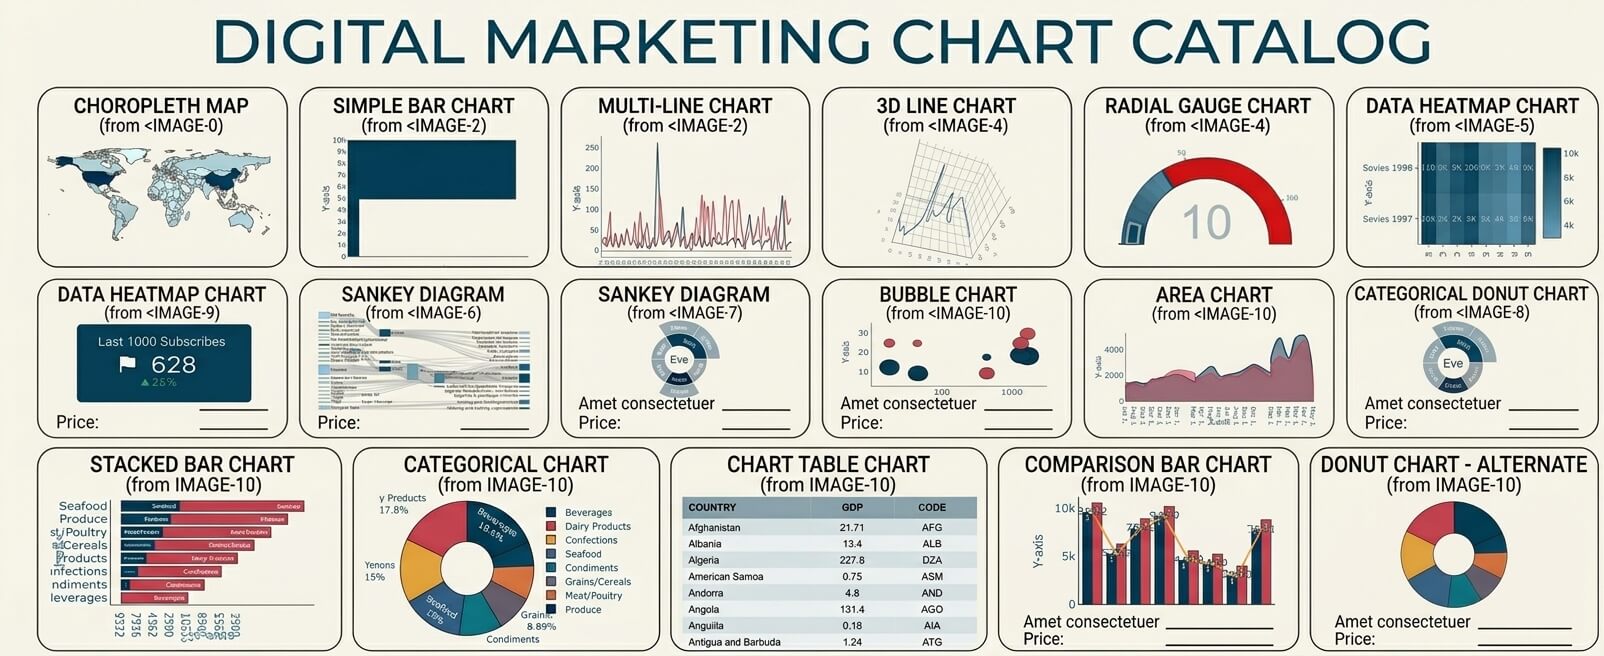
Make Charts Directly from Your Database
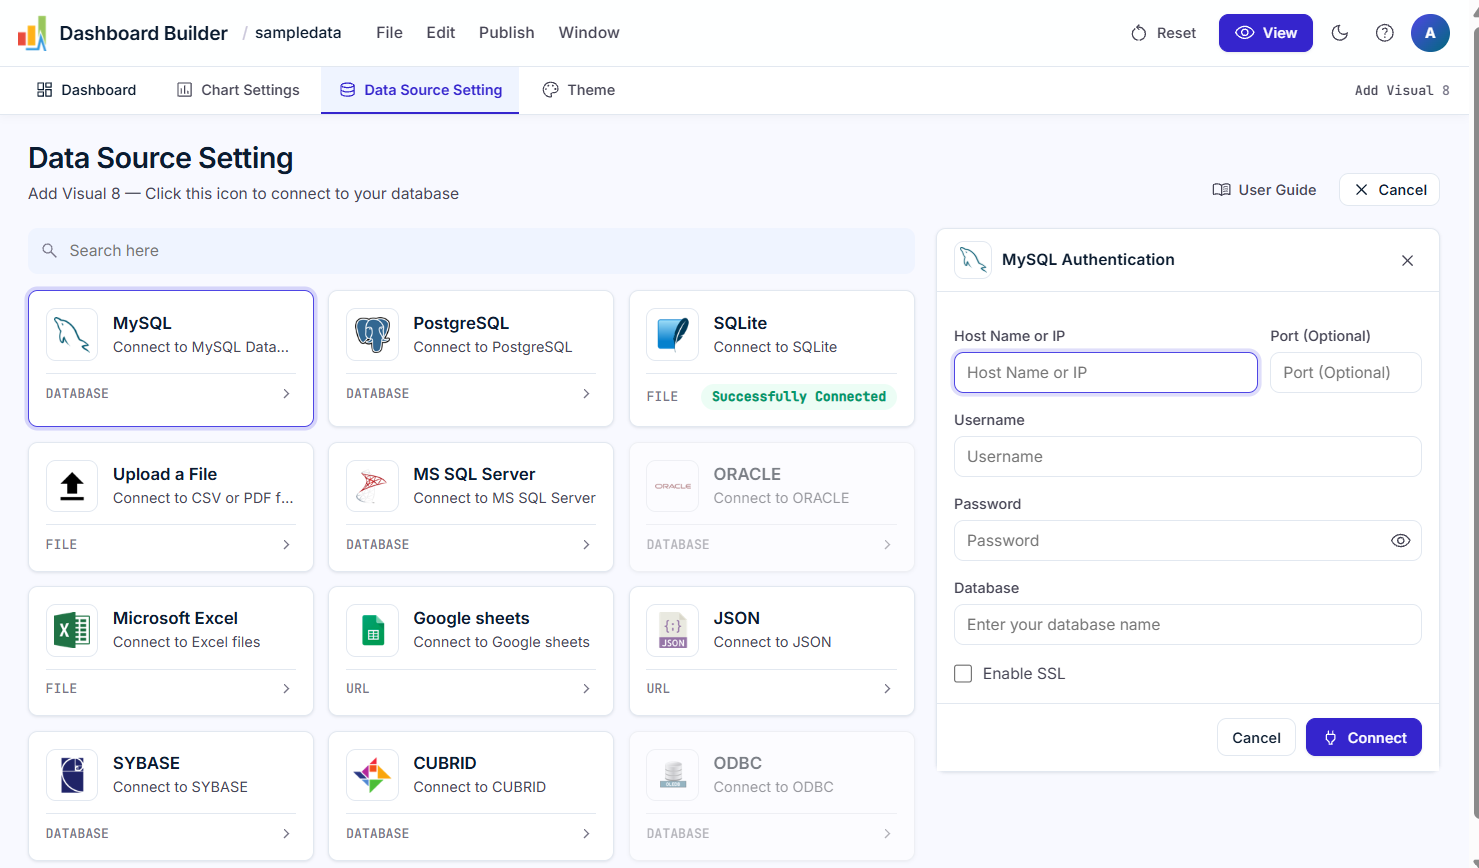
Chart Maker also connects directly to MySQL, PostgreSQL, SQL Server, Oracle, SQLite, Google Sheets and 25+ other data sources. Use the built-in SQL generator to pull the data you need, build the chart with drag-and-drop, and it stays up to date as your data changes. For a step-by-step walkthrough with screenshots, see the Chart Builder guide.
Download, Share and Embed Your Charts

Save your chart as an image for a report or slide, share it with a link, or generate PHP/HTML5 code and embed it live in WordPress, Joomla, Laravel or any web page. Charts are responsive, so they look right on a phone, tablet or PC.
Online, Download or Desktop
Frequently Asked Questions

Keep reading
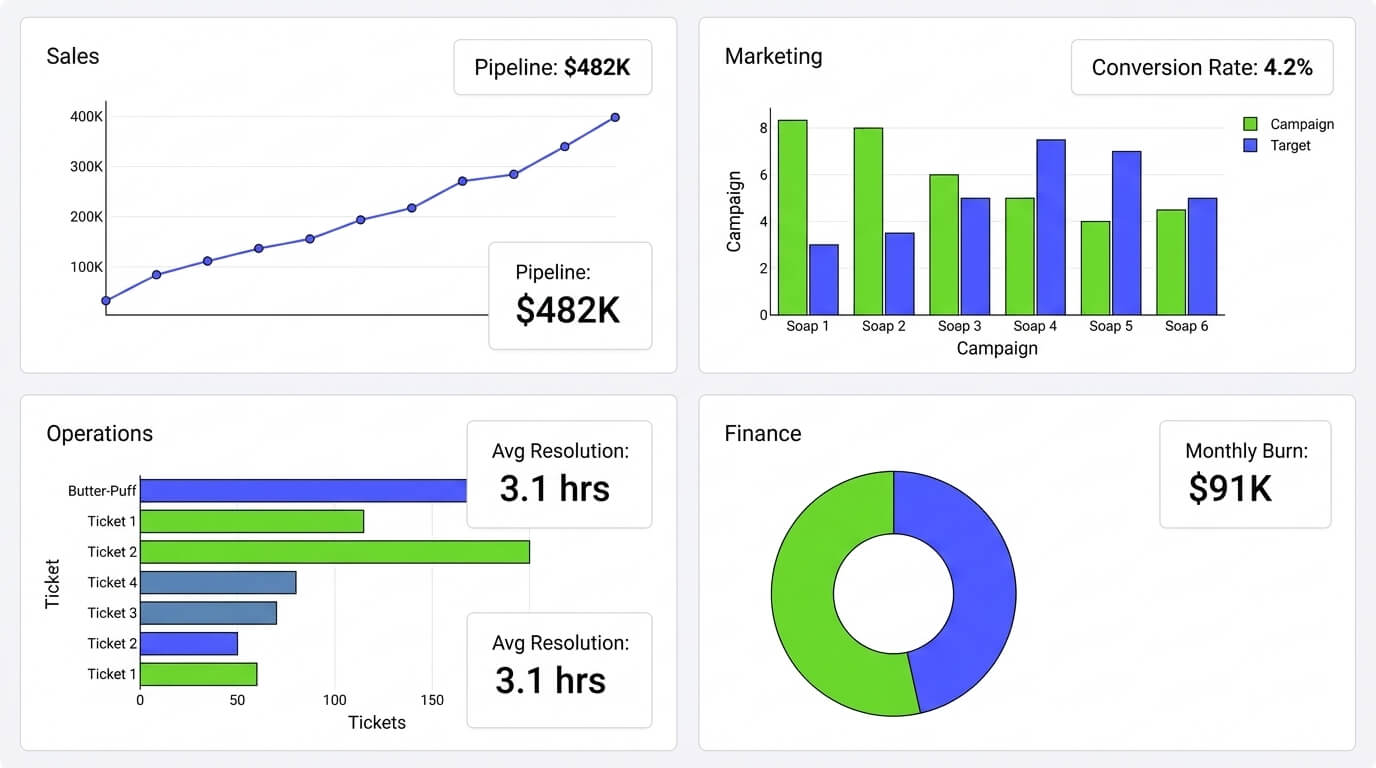
Dashboard Builder for Every Team
Dashboard Builder for Every Team: Sales, Marketing, Ops & Finance Connect any data source once, and the same no-code tool builds a…
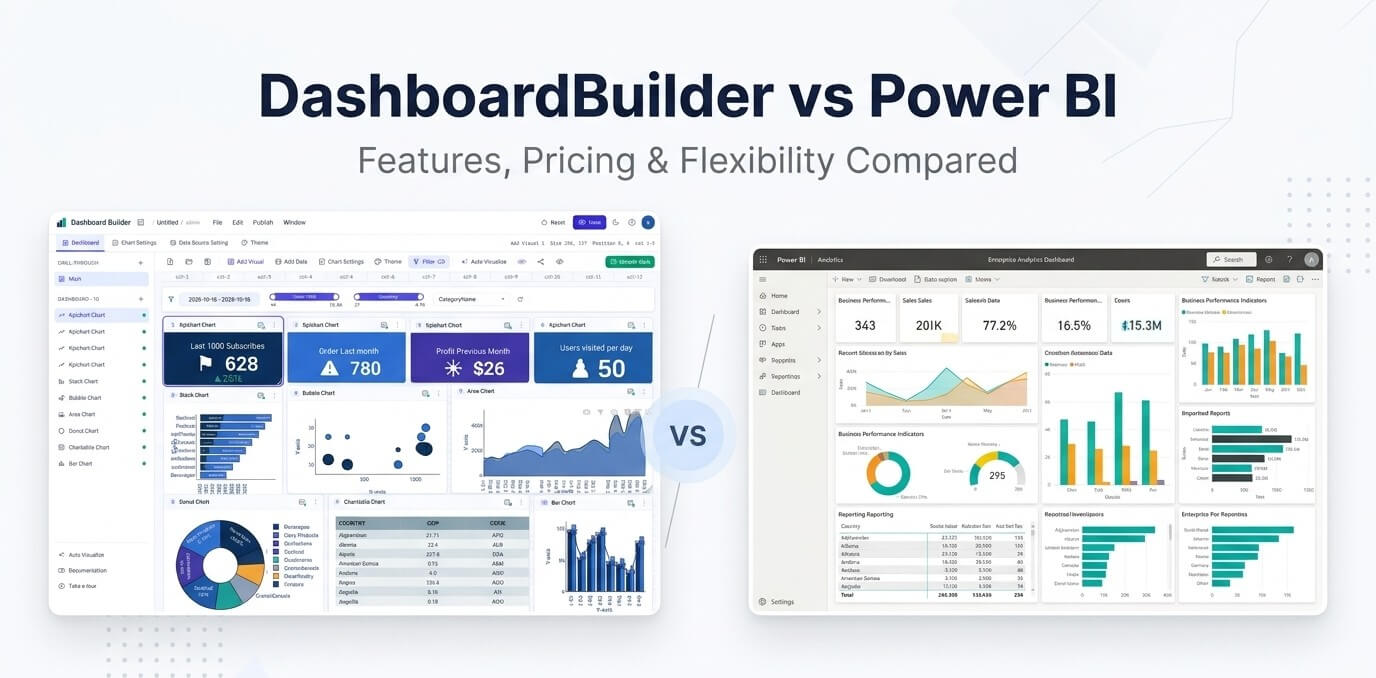
Dashboard Builder vs Power BI
Dashboard Builder vs Power BI An honest comparison of features, hosting and price, with Power BI prices checked on 17 October 2026.…

SaaS Dashboard — Free Cloud Dashboards | No Credit Card
SaaS Dashboard — Free, Cloud-Based (No Credit Card) Build interactive cloud dashboards, ask questions in natural language, and embed live visualizations —…