What is a Real Time Dashboard?
A real-time is a kind of dashboard that automatically fetches the latest and most current data available with real time streaming and update dashboards in real time without reloading the entire page. As soon as a change is made to the data it reflects the dashboard immediately..

Overview
A real time dashboard is a dynamic dashboard that updates automatically after a certain interval. Whenever a change is made to a record it refreshes the dashboard dynamically with real time data to show the latest data set available.
The Dashboard Builder is a drag and drop, easy-to-use, browser-based visualization tool with real time streaming data set which lets you stream data and update dashboards in real time without reloading the entire page. Any visual or dashboard created in the Dashboard Builder can display and update real time data and visuals. The sources of streaming data can be a stock exchange, factory sensors, service usage metrics, or many other time-sensitive data collectors or transmitters.
The Dashboard Builder uses JSON as data source to read data set and stream it in real time. No data is stored by the service and the call is made from the web client directly.
Benefits of real time dashboards
A real time dashboard is a performance monitoring and analyzing tool used to track, and report on the company’s data in real time with the help of interactive and dynamic data visualizations. This real time data dashboard is automatically updated after a certain defined interval and provides instant vision to critical data.
Real Time Dashboard Examples
There are a variety of examples of the benefits of using real time dashboards and live dashboard examples in multiple industries.
Organizations especially operate in constantly changing dynamic environments, whether that means sales ebbs and flows, industry fluctuations, or the effect of certain news stories on the market, require constantly monitoring tool that helps them to identify emerging trends and monitor efficiency with real time data.
Following are the rich examples of the real time dashboard from numerous functions, industries, and platforms that can be used for your own dashboard building process, and generate actionable and real time insights.
1. Real time dashboards at Warehouse
The most promising use case of using a real time dashboard is deploying just-in-time inventory management. Companies that maintain minimal warehousing must constantly monitor their real time data for updates on current in-store levels, sales, and replenishing levels.
In the presents of real time dashboards, re-ordering has to arise quickly and efficiently to avoid surpluses or shortages. An inventory manager could centralize these figures to uncover Business Intelligence insights that might help by using a real time live dashboard. It could also help to set automatic re-supply triggers when certain products are running low or improve ordering by highlighting the demand for certain goods.
Bottlenecks in supply chains, over-ordering of products, or long hold times at other centers can mean damages to the business and losses in profits. Constantly monitoring productivity in real time enables to make quick decisions easier with greater confidence.
2. Real time dashboards at Couriers and Logistic companies
Another real time dashboard example is for couriers and logistic companies. Companies that handle shipping worldwide, require moving precise data from multiple sources to function smoothly. Data such as estimated delivery times, current locations, the status of the partial, outstanding orders, and more need to be monitored properly to avoid stick-ups and ensure deliveries arrive at the correct destination without any delay Real time dashboard lets users make quicker decisions about rerouting couriers, prioritizing orders, and streamlining their delivery process.
3. Real time dashboards at Brokerage and Securities, companies
One of the most common usages and benefits of real time dashboard examples is financial institutions such as investment banks, brokerage, securities, and exchange companies. Such companies require consistently observe the stock exchange rate from live data to make the right decision of trade for security bounds and market share at the right time.
In the new era of information technology, flux produces operational challenges that must always be closely monitored. Adding a real time dashboard lets executives and other non-technical users interpret the results and find ways to reduce costs easily by visualizing expenses and resource allocation in real time.
How to Create Real Time Dashboards
When you create a Real time dashboard, you get insights into your business health, pulling information from real time data to visualize trends and make visions easy to identify.
What You Need to Create a Real Time Dashboard?
To create a real time dashboard, you need the dashboard builder a data visualizing tool for the real time dynamic dashboard. The dashboard builder has the ability to fetch data from JSON, and a way to visualize it in real time without coding.
Once you have your JSON file in one place, you need the ability to fetch the data you need using the Dashboard Builder. With the help of the dashboard builder you don’t need to know SQL to fetch data, just use our SQL query tool, which allows you to query data without code.
In the next phase, you need a way to visualize your results with live data. To create a real time dashboard, you need to export your SQL data into JSON. How to fetch SQL data into a JSON file, take a look at this article. Alternatively, you can export your query result from MySQL as a CSV and plug it into Google Data Studio or Excel.
Requirements
There are very easily attainable requirements to run Real Time Dashboard. The real time dashboard was built by the pioneer dashboard builder firm, a kind of flimsy utility, which was built in an intelligible way and does need minimal requirements to run.
Pre-requisites
Before starting this tutorial, you should:
- PHP Version 7 or later
- Apache 2 or later
- JSON is enabled
Take a look at this how to guide If you are using a desktop version of the Dashboard Builder in MS Windows.
Real time Dashboard runs on all SVG-compatible browsers such as:
- Windows 7 or later /Linux 3 or later
- Firefox 52, Chrome 57, IE
- Real time Dashboard Builder is available for downloading
Installation
There is a Free version of the real time dashboard builder also available
- You can download the dashboard dashboard code fromDownload Dashboard Builder
- Place the files in a directory on the web server. e.g.
…/www/yoursite/dashbboardbuilder-v4-FREE/ - Unzip
 the file dashboard.zip using Extract Here option to the root folder of "dashboardbuilder"
Fetch your JSON data
With the help of the following easy steps, you can fetch complex data from a JSON file and create the highest level of extremely attractive dashboards for professional businesses with zero codings and without programming skills in a matter of minutes.
- Retrieve JSON data through JSON dashboard
- Assign data to X and Y-axis column.
Retrieve JSON data through JSON dashboard
This section of the article helps you to understand how to connect to JSON data. To proceed further, you need to make sure that you have already installed the dashboard builder tool and you meet all the prerequisites .
- STEP-1 Launch the dashboard builder, if you are using on-prem version then run the dashboard builder in a browser
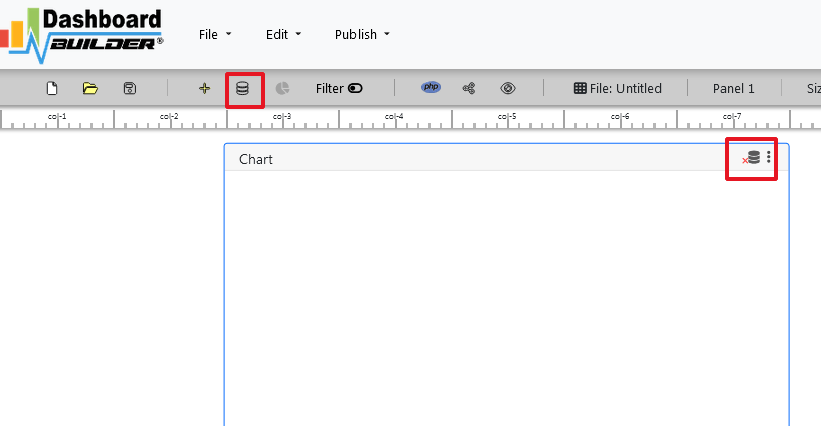
- STEP-2 Click the database icon
- STEP-3 On the File tab, enter the URL of your JSON or API and hit the Save Changes button.
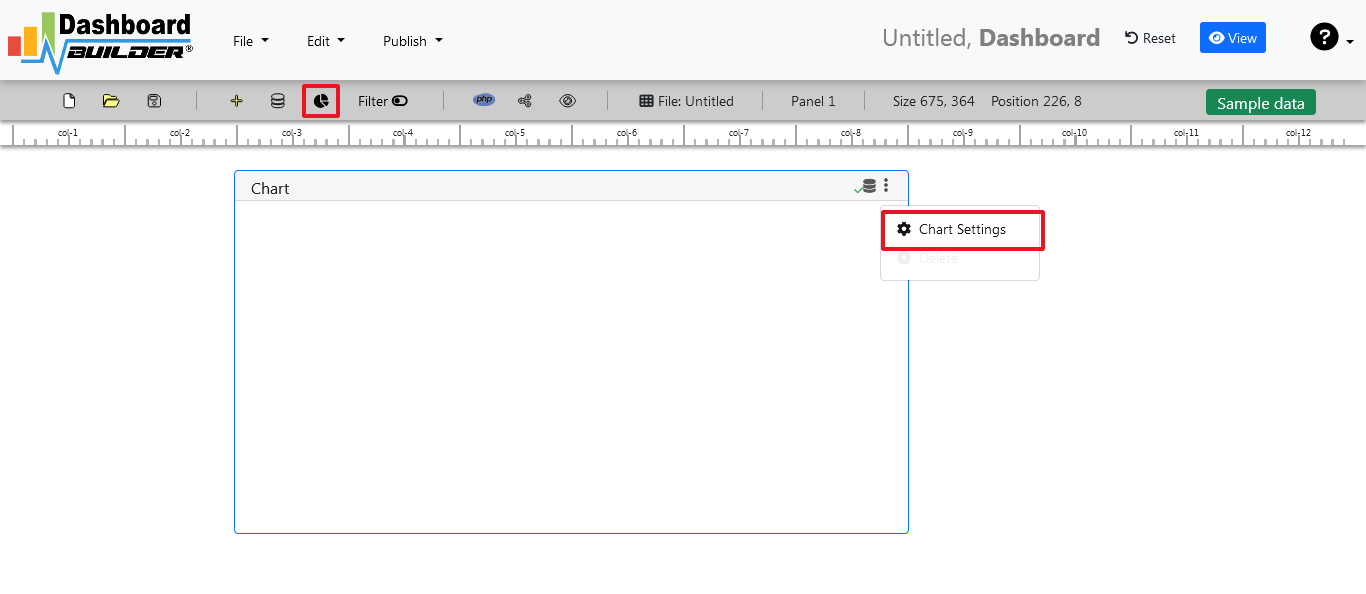
- STEP-4 Click the gear icon to open the chart properties windows
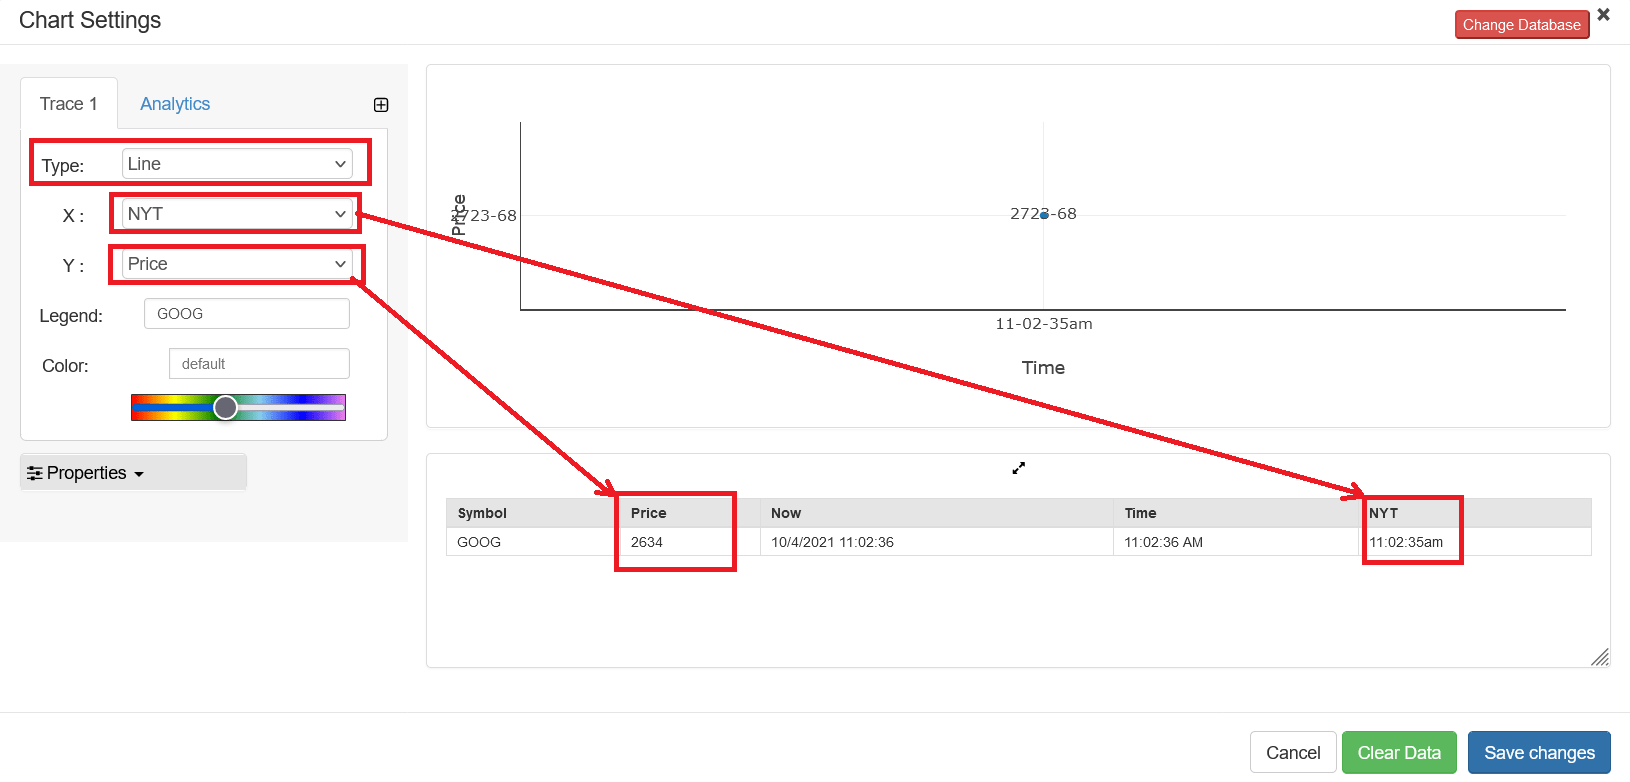
- STEP-5 On the next screen; select Line chart from the drop-down list of chart type. Select appropriate column for X-axis and Y-axis. In the below example we are using a GOOGLE Financial data, hence. NYT was chosen for X and Price was chosen for Y axis.
- STEP-6 Now, click the Properties to extend the tab.
- STEP-7 Save your changes and your real time streaming dashboard is live. You have various options to publish your real time dashboard.


You may notice there is a new option Refresh. This button only appears when a JSON file is being used as a data source.

You can set your desire interval to refresh the data. You can also turn your real time dashboard to a real time streaming dashboard, which lets you stream data and update the dashboard.
Share your real time dashboard with your team
You can publish and share your dashboard with your team using just one click. This great dashboard tool for the real time Dashboard generates the URL for your dashboard to share with your colleagues. Not only this, the dashboard builder has a powerful PHP code generator plugin installed, which generates PHP code for your dashboard in just one click. This auto-generated PHP code for your dashboard is published under the MIT license, which you can customize as per your desired needs and can be used or embedded inside of your PHP application.
 the file dashboard.zip using Extract Here option to the root folder of "dashboardbuilder"