Open Source Business Intelligence (BI) Tool – Download FREE
Revolutionizing the Analytics Industry with the Open Source Business Intelligence Tool
Business Intelligence (BI) tools are essential. for any organization to make informed and data-driven decisions. In today's fast-paced and constantly evolving business environment, effective BI tools are more important than ever. Organizations are looking for cost-effective and efficient solutions that can help them analyze their data and gain insights in order to stay ahead of the competition. Open-source BI tools have emerged as a popular choice among organizations due to their flexibility, cost-effectiveness, and scalability.

What are Open Source Business Intelligence Tools
Open-source BI tools are free software solutions that can be used and modified by anyone. The source code for these tools is open to the public such as at Open source BI at Github, and developers can modify and customize it to meet their specific requirements. The open-source nature of these tools means that organizations do not need to pay any licensing fees or purchase expensive proprietary software.
Advantages of Open Source Business Intelligence Tools
One of the key benefits of open source business intelligence (BI) tools is their flexibility and customizability. Open source BI tools allow users to customize and expand the software to meet their specific needs and integrate with other tools and systems. This can result in cost savings, as users can avoid the licensing fees associated with proprietary BI software, and also enables more innovation and collaboration within the open source community. Additionally, open source BI tools often have a large and active user community, providing access to a variety of resources, support, and knowledge-sharing opportunities.
The Open Source BI tool has unique set of features and capabilities. Some of the most popular are include:
- Cost-effective: One of the primary advantages of open-source BI tools is their cost-effectiveness. Organizations can save a significant amount of money on licensing fees and software costs. Additionally, they can avoid vendor lock-in and switch between different open-source BI tools based on their requirements..
- Flexibility:: Open-source BI tools offer greater flexibility than proprietary software solutions. Organizations can add new features, integrate the software with other programs, and modify the software to suit their particular requirements.
- Scalability: : Open-source BI tools can be used to analyze vast amounts of data and are highly scalable. As their data requirements increase, organizations can add new hardware and servers.
- Community : Support: Open-source BI tools have a large developer community that is constantly improving and updating the software. These updates and patches provide organizations with access to a wealth of knowledge and resources.
Case Study: How an Open-Source BI Tool helped a Retail Chain
A leading retail chain in the United States was having difficulty with its sales data. The company had a variety of sales channels, including physical stores and an e-commerce website. The data from these channels, however, was stored in separate databases and was not integrated. The retail chain required a BI tool that could integrate data from multiple sources and provide executives with real-time insights.

The company chose an open-source BI tool that enabled it to integrate data from a variety of sources, including its point-of-sale systems, e-commerce website, and social media channels. The tool provided real-time dashboards and reports to executives, allowing them to make informed decisions about inventory management, pricing, and marketing.
The open-source BI tool also allowed the company to customize and modify the software to meet its specific needs. The company's IT team developed custom application that helped integrate data from new sources and created new reports and dashboards to meet the changing needs of the business.
The Result: The retailer was able to gain real-time insights into its sales data and make informed pricing, inventory management, and marketing decisions. The open-source BI tool helped the company save money on licensing fees and software costs. The IT team at the company was able to customize and modify the software to meet its specific requirements, as well as integrate data from new sources. The tool also enabled the company to scale up as its data requirements increased.
Open source FREE bi tool for PostgreSQL and Apache
Transform your data into insights with the freedom of Open Source BI for PostgreSQL and Apache.
One popular open-source BI tool for PostgreSQL is the Dashboard Builder. The Dashboard Builder is a business intelligence and analytics tool that allows users to visualize and explore data from their PostgreSQL databases. It offers a user-friendly interface for creating charts, graphs, and dashboards without requiring advanced technical knowledge.
The Dashboard Builder is built with PHP, Javascript and uses a web-based interface, making it accessible from any web-enabled device. It also supports multiple data sources, including PostgreSQL, MySQL, and Microsoft SQL Server, among others.
The Dashboard Builder’s features include:
- Easy setup and installation with minimal configuration required
- Intuitive drag-and-drop interface for creating dashboards and reports
- Supports multiple chart types, including line charts, bar charts, and scatterplots
- Allows for custom SQL queries to be run against the data
- Built-in support for user permissions and role-based access control
- Automatic database schema detection, making it easy to connect to your PostgreSQL databases
- Advanced filtering options, including date range filters, grouping, and sorting
The Dashboard Builder is highly customizable and extensible, with a wide range of web programming languages and integrations available. It is also actively maintained and supported by a large community of developers and users.
Open Source BI tool Tutorial
APPLIES TO: On-premises Online Desktop

In this article, we'll use the Dashboard Builder Tool to create a Business Intelligence Report and retrieve data from a PostgreSQL database, as well as generate PHP source code.
Prerequisites
PosgreSQL Dashboard can be installed any platforms like Windows, Linux and Ubuntu or any other platforms support Apache, Nginx etc.
Requirements
- PHP Version 7.2 or later
- Apache 2 or later
- PostgreSQL database
- PDO and pdo_pgsql
- Windows 7 or later /Linux 3 or later
- Firefox 52, Chrome 57, IE
- PostgreSQL Dashboard is available for downloading
Installation
There is a Free version of PostgreSQL dashboard available for trail bases,
- You can download PostgreSQL dashboard code fromDownload PostgreSQL Dashboard
- Place the files in a directory on the web server. e.g.
…/www/yoursite/dashbboardbuilder-v3-FREE/ - Unzip
 the file dashboard.zip using Extract Here option to the root folder of "dashboardbuilder"
Steps to build PostgreSQL dashboard
STEP-1: Connect with PostgreSQL Database
- Run the web folder in your browser. e.g. http://localhost/dashboardbuilder following welcome screen will appear.
"database-name" in the DB name field and click Save changes button.

Tip: If your database is not in the public schema, then you can use your schema name in this manner 127.0.0.1:5432/Schema in the host field.
- When you click the save changes, a green tick mark with Database will appear that shows that your database is successfully connected.

Tip: To retrive data from PostgreSQL database, PDO driver 'pdo_pgsql' must be installed. For more details please have a look at our Documentation
STEP-2: Chart settings
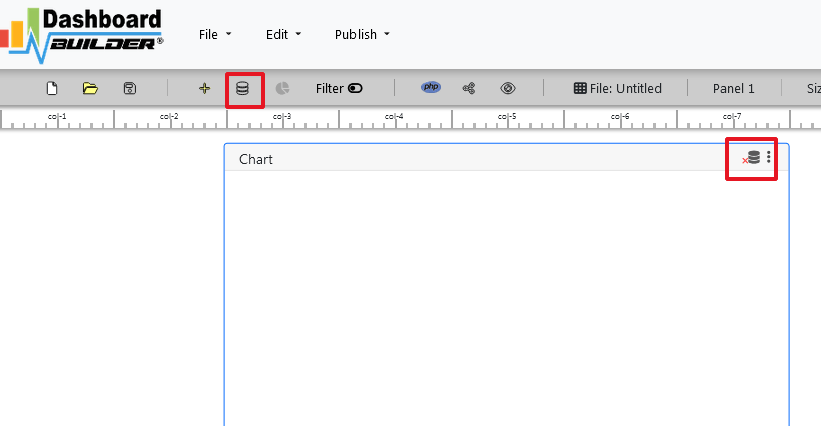
- After successfully connect to your PostgreSQL database, we will retrieve data from your database in our next step.
- Select the gear icon.
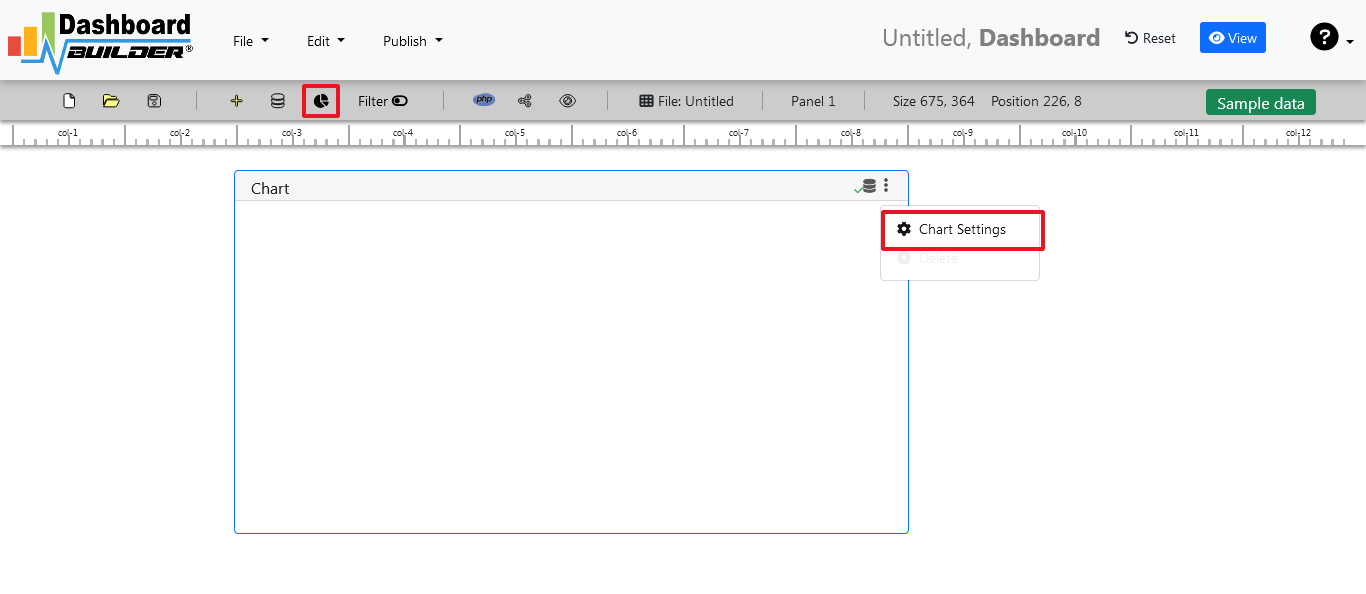
- A pop-up screen will appear and a list of the tables from your PostgreSQL database will appear on the table list as shown in the picture below.

PostgreSQL dashboards have a powerful Query Builder, a smart SQL statement builder tool for quick and easy writing of complex SQL queries without manual code writing which is designed to simplify the retrieving of data from the database.
- When you click on the table, a default SQL statement will appear on the SQL statement box, which you may modify as per your need.
- You can add up to 10 SQL statements simultaneously to retrieve data from different tables.
STEP-3: pgSQL statements
- In our example, we will be creating a simple PHP application for our sales management. This PHP dashboard will contain a chart where users can find the sales stats and maintain the data about the products.
- Now, enter the pgSQL statement in text box in a following manner
SELECT strftime('%Y-%m',o.shippeddate) as xaxis, sum(d.quantity) as yaxis from `order details` d, orders o where o.orderid = d.orderid group by strftime('%Y-%m',o.orderdate) limit 50
- Now, we want to execute our query and fetch the data from the tables. Click the Run Query button

- Query Result will appear. Now, we have to assign x-axis data to the x-axis column and y-axis data to the y-axis column. Select your x-axis data from the drop down list of X and y-axis data from the drop down list of Y .
- Click Save Changes
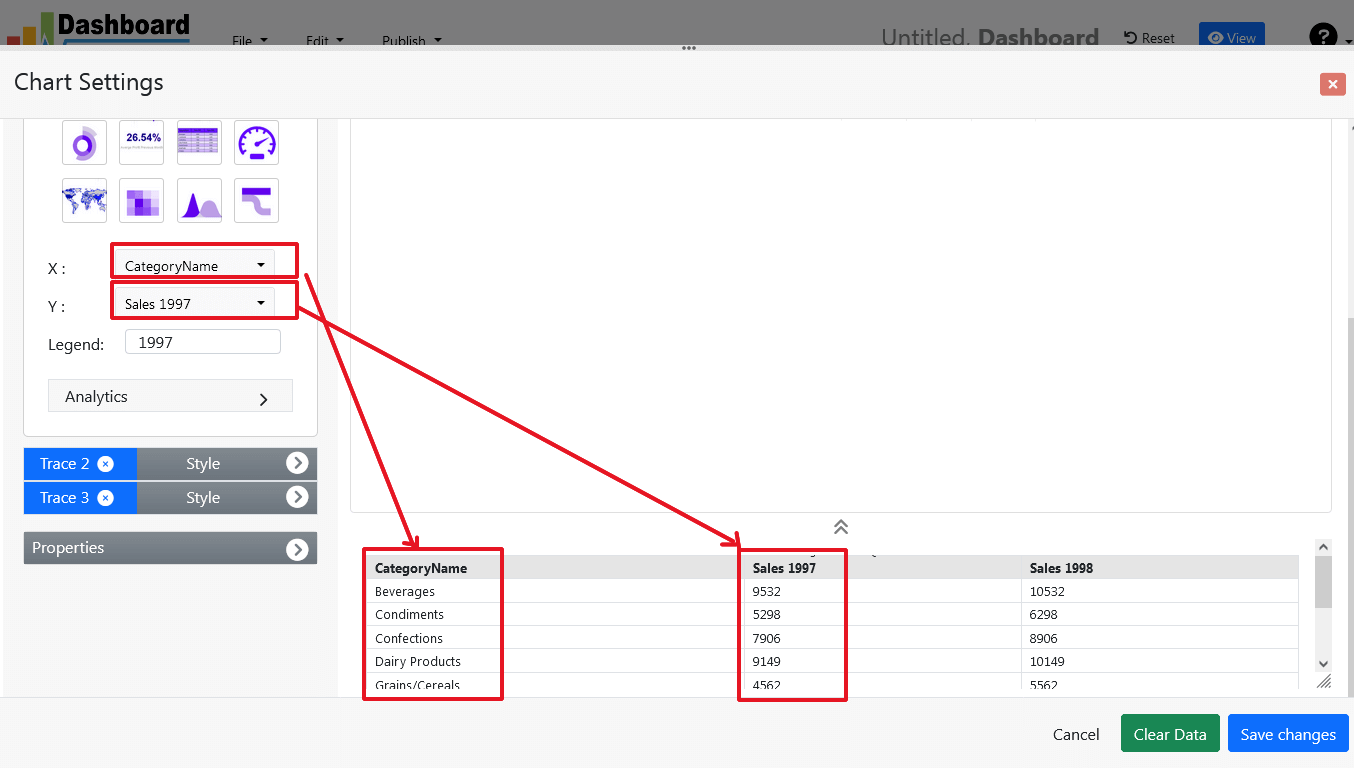
- Charts will be appeared on the screen as shown below.
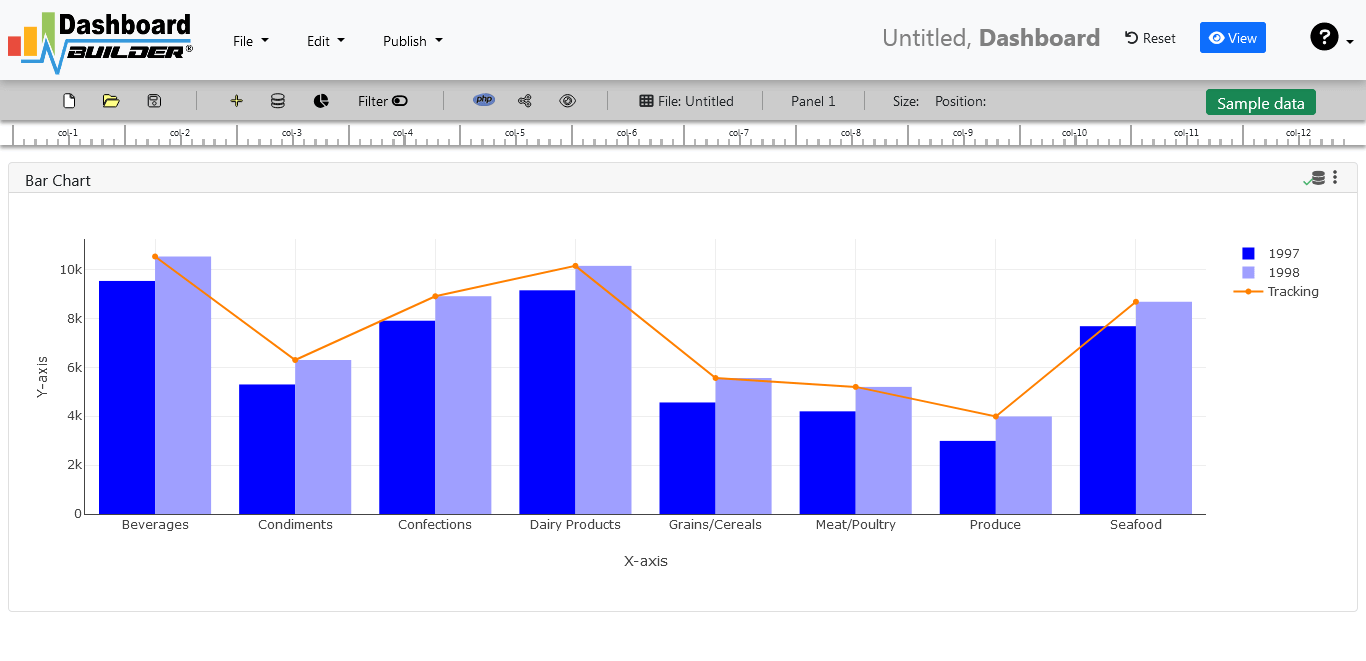
STEP-4: Adjust the position
- You may adjust the size and the position of the Chart Panel by dragging its corner. The size and position are fully responsive according to the Bootstrap framework
STEP-5: Generate PHP and Postgresql dashboard source code
- So far we have successfully build our dashboard. In this step we are going to generate PHP dashboard source code we have just created. Click the Generate button to auto-generate PostgreSQL dashboard source code for our PHP application

- PostgreSQL dashboard source code for the chart will automatically generate, you may copy past this script of dashboard to your PHP application.
Open Source Code for the BI tool
/**
 * DashboardBuilder
 *
 * @author Diginix Technologies www.diginixtech.com
 * Support  - http://www.dashboardbuilder.net
 * @copyright (C) 2018 Dashboardbuilder.net
 * @version 2.1.7
 * @license: license.txt
 */

include("inc/dashboard_dist.php");  // copy this file to inc folder


// for chart #1
$data = new dashboardbuilder();
$data->type =  "line";

$data->source =  "Database";
$data->rdbms =  "pgsql";
$data->servername =  "your-servername";
$data->username =  "userid";
$data->password =  "password";
$data->dbname =  "your-db-name";
$data->xaxisSQL[0]=  "SELECT strftime(^%Y-%m^,o.shippeddate) as xaxis, sum(d.quantity) as yaxis from `order details` d, orders o  where o.orderid = d.orderid group by strftime(^%Y-%m^,o.orderdate) limit 50";
$data->xaxisCol[0]=  "xaxis";
$data->yaxisSQL[0]=  "SELECT strftime(^%Y-%m^,o.shippeddate) as xaxis, sum(d.quantity) as yaxis from `order details` d, orders o  where o.orderid = d.orderid group by strftime(^%Y-%m^,o.orderdate) limit 50";
$data->yaxisCol[0]=  "yaxis";
$data->name = "linechart";
$data->title = "Line Chart";
$data->orientation = "";
$data->xaxistitle = "x-axis title";
$data->yaxistitle = "y-axis title";
$result[0] = $data->result();

?>

<!DOCTYPE html>
<html>
<head>
	<script src="assets/js/dashboard.min.js"></script> <!-- copy this file to assets/js folder -->
	<!--<link rel="stylesheet" href="assets/css/bootstrap.min.css"> Bootstrap CSS file, change the path accordingly -->


</head>
<body>

<div class="container">
<div class="col-lg-12">
<div class="panel panel-default">
<div class="panel-heading"></div>
    <div class="panel-body">
        <?php echo $result[0];?>
    </div>
</div>
</div>
</div>
</body>
Conclusion
Open-source BI tools are revolutionizing the analytics industry by providing organizations with cost-effective, flexible, and scalable solutions. These tools are popular because they are open-source, allowing developers to modify and customize the software to meet their specific needs. Open-source BI tools also have a large developer community that is constantly improving and updating the software, giving organizations access to a wealth of knowledge and resources.
As organizations continue to generate and store more data, the need for effective BI tools will only continue to grow. Open-source BI tools provide organizations with a cost-effective and
 the file dashboard.zip using Extract Here option to the root folder of "dashboardbuilder"