Create Combination chart and generate PHP code for your apps
A combination chart combines different types of charts. For example, a combination of line, bar, are, etc. It is noted that the series of chart types are rendered in the order they appear in trace array and as a result, they overlap others. A line chart, bar chart, area charts, histogram or scatter chats cannot be combined with any other chart type.
Dashboard Builder helps you to create combination chart with a drag and drop tool and a SQL engine with ease. Dashboard Builder generates PHP source code for you to use it anywhere in your application.
Requirements
- PHP Version 7.2 or later
- Apache 2 or later
- Windows 7 or later /Linux 3 or later
- Firefox 52, Chrome 57, IE 8
Installation
- Download from https://dashboardbuilder.net/download-free-dashboard
- Place the files in a directory on the web server. e.g.
…/www/dashboar/dbuilder/ - Unzip
 the file using Extract Here option to the root folder of "dashboardbuilder"
Create your first Combination Chart
- Access the web folder in your browser. e.g. http://localhost/dashboardbuilder following welcome screen will appear

- Now Click the Database icon
- Following screen will appear. Select Database from data source tab. Select SQLite from the list of Database, Enter your
"Northwind.db"in the DB name field and Save changes as mentioned in the screen.

- Enter user name and password of your database.
- A green tick mark with Database will appear when your database is successfully connected.

- Select the chart settings button.

- The following screen will appear with a list of the tables.

- Enter your SQL statement in text box.
select c.categoryname, sum(a.quantity) as 'Sales 1997', sum(a.quantity)+1000 as 'Sales 1998' from products b, `Order Details` a, categories c where a.productid = b.productid and c.categoryid = b.categoryid group by c.categoryid order by c.categoryid;
- Click the Run Query button
- The query result will be displayed.
- Choose "Bar" as the Chart Type for Trace 1. Select CategoryName from the X drop down list and Sales-1997 from the Y drop down list..
- Now, click to add Trace 2
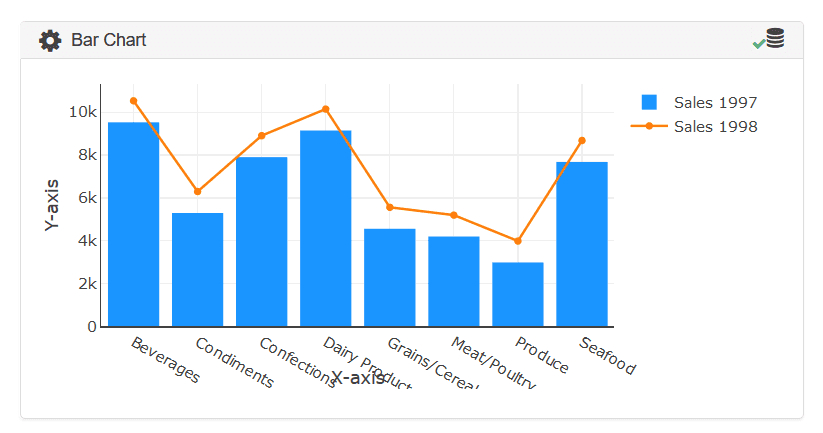
- Choose "Line" from the Type drop down list for Trace 2. Select CategoryName from the X drop down list and Sales-1998 from the Y drop down list. Click the Save Changes button to apply the changes.

- Charts will be appeared on the screen as shown below.

- Now extend the Generate button and click on the PHP Code

- The chart's PHP code will be created automatically, and you may copy and paste it into your PHP application.
PHP Code
/**
 * DashboardBuilder
 *
 * @author Diginix Technologies www.diginixtech.com
 * Support  - http://www.dashboardbuilder.net
 * @copyright (C) 2018 Dashboardbuilder.net
 * @version 3.0
 * @license: license.txt
 */

include("inc/dashboard_dist.php");  // copy this file to inc folder


// for chart #1


$data = new dashboardbuilder();
$data->type[0]=  "bar";
$data->type[1]=  "line";

$data->source =  "Database";
$data->rdbms =  "sqlite";
$data->servername =  "";
$data->username =  "";
$data->password =  "";
$data->dbname =  "../data/Northwind.db";
$data->xaxisSQL[0]=  "select c.categoryname, sum(a.quantity) as ^Sales 1997^, sum(a.quantity)+1000 as ^Sales 1998^ from products b, `Order Details` a, categories c where a.productid = b.productid and c.categoryid = b.categoryid group by c.categoryid order by c.categoryid ;";
$data->xaxisCol[0]=  "CategoryName";
$data->xaxisSQL[1]=  "select c.categoryname, sum(a.quantity) as 'Sales 1997', sum(a.quantity)+1000 as 'Sales 1998' from products b, `Order Details` a, categories c where a.productid = b.productid and c.categoryid = b.categoryid group by c.categoryid order by c.categoryid ;";
$data->xaxisCol[1]=  "CategoryName";
$data->yaxisSQL[0]=  "select c.categoryname, sum(a.quantity) as ^Sales 1997^, sum(a.quantity)+1000 as ^Sales 1998^ from products b, `Order Details` a, categories c where a.productid = b.productid and c.categoryid = b.categoryid group by c.categoryid order by c.categoryid ;";
$data->yaxisCol[0]=  "Sales 1997";
$data->yaxisSQL[1]=  "select c.categoryname, sum(a.quantity) as 'Sales 1997', sum(a.quantity)+1000 as 'Sales 1998' from products b, `Order Details` a, categories c where a.productid = b.productid and c.categoryid = b.categoryid group by c.categoryid order by c.categoryid ;";
$data->yaxisCol[1]=  "Sales 1998";


$data->name = "0";
$data->title = "Combination Chart";
$data->orientation = "v";
$data->xaxistitle = "Months";
$data->yaxistitle = "Profit";
$data->showgrid = "true";
$data->showline = "true";
$data->height = "266";
$data->width = "";
$data->col = "0";
$data->tracename[0]=  "Rainy Day";
$data->tracename[1]=  "Profit";
$data->color[0]=  "#1A94FF";

$result[0] = $data->result();?>

<!DOCTYPE html>
<html>
<head>
	<script src="assets/js/dashboard.min.js"></script> <!-- copy this file to assets/js folder -->
	<!--<link rel="stylesheet" href="assets/css/bootstrap.min.css"> Bootstrap CSS file, change the path accordingly -->


</head>
<body>

<div class="container">
<div class="col-lg-12">
<div class="panel panel-default">
<div class="panel-heading"></div>
    <div class="panel-body">
        <?php echo $result[0];?>
    </div>
</div>
</div>
</div>
</body>