Business forecasting dashboard overview
Business Forecasting Dashboard is a data forecasting dashboard powered by the Dashboard Builder, a machine learning engine that provides statistics to predict the future. It is available for all platforms including Windows, Linux and Mac. The Forecasting Dashboard is scalable, flexible and required no code.

What is business forecasting dashboard?
Business forecasting dashboard aggregates and analyses historical data to anticipate future outcomes in a single glance, this technique is also called Predictive analytics. Predictive analytics leverages statistical techniques like data modeling and machine learning.
While these outcomes cannot predict exactly what will happen in the future, a business forecasting dashboard helps you to identify trends, herald disruptive industry changes, and allow data-driven decision making.
Forecasting dashboard in the real world
Forecasting dashboard uses data analysis to predict future outcomes, allowing you to gain valuable insights and make more informed business decisions. With a forecasting dashboard, you can use your data to recognize trends, predict future events, and identify business risks and opportunities. No matter your industry, a forecasting dashboard helps you anticipate your business needs and understand consumer trends.
How forecasting dashboard works
Forecasting dashboard analyses data to predict future events from stems of statistical science. Predictive modeling involves giving the presence of particular variables in a large dataset a certain weight or score. This score is then used to calculate the probability of a certain event occurring in the future. For this reason, the forecasting dashboard uses regression modeling approaches in predictive analytics.
Regression models
Regression models are less black and white. Instead of a 0 or 1, regression models will predict an actual number. Consider an example in healthcare: let’s say a member has a BMI of 29. A regression model might predict that the member’s BMI could drop 3 points in the next year with a consistent, healthy diet.
There are several techniques data scientists use to construct classification and regression models. The least-squares regression technique uses to find the estimated outcome.
Forecasting dashboard in the dashboard builder is a Statistical Function that computes the linear trend line based on the given linear set of data. It calculates the predictive values of Y for given array values of X and uses the least square method based on the given two data series. The forecasting dashboard returns numbers in a linear trend matching known data points that is the existing data on which the trend in dashboards predicts the values of Y dependent on values of X needs to be linear data.
What is the least square Technique?
The Least Squares Regression Line is the line that makes the vertical distance from the data points to the regression line as small as possible. It’s called a “least squares” because the best line of fit is one that minimizes the variance (the sum of squares of the errors). This can be a bit hard to visualize but the main point is you are aiming to find the equation that fits the points as closely as possible.
It is a technique used in the regression analysis that finds the line of best fit (is a line through a scatter graph of data points that foremost indicates the relationship between those points) for a given dataset, which helps to visualize the relationship between the data points. .
How to Use forecasting in the dashboard builder?
With these great tips and expert techniques in the examples were used to create your forecasting dashboard in a remarkable and simple way to facilitate you to create the highest level of extremely attractive predictive analytic dashboards for professional businesses with no code and without programming skills required, in a matter of minutes.
Forecasting in the dashboard builder is very simple and easy to use. Let us understand the working of the forecast function by the following example.
Predicting the Sales Growth
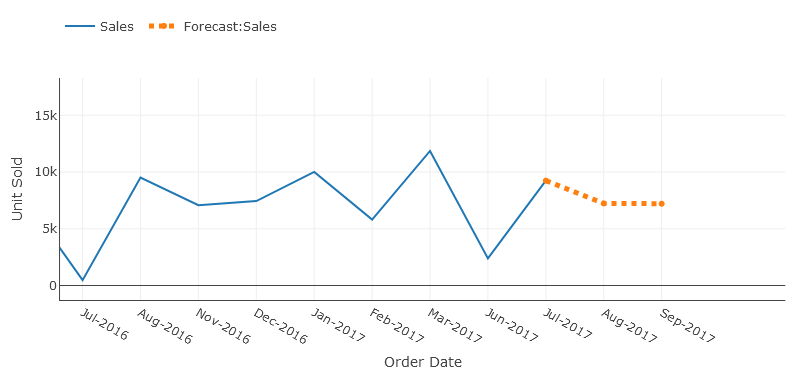
In the following example, we have existing sales data of a company for the fiscal year 2016-2017 that increases linearly from July 2016 to June 2017. We need to figure out the sales for the given upcoming months. That is, we need to predict the sales values based on the predictive values for last year's data.
The existing data contains the order date and the unit sold. We need to calculate the estimated sales value for the next 5 iterations. Historical Data is given below:

In order to predict the sales for the given upcoming months in the next fiscal year, we will use the forecasting function in the analytics tab since the sales value is increasing linearly, the given known values of Y is the item sold, and the known values of X are the order dates of the month, the new values of X are the dates for next months. The difference between months is automatic calculated using the standard division functions., and we need to compute the estimated sales values based on historical data given.
Requirements
There are very easily attainable requirements to run your Business Forecasting Dashboard. The Forecasting Dashboard was built by the pioneer dashboard builder firm, a kind of flimsy utility, which was built in an intelligible way and does need minimal requirements to run.
Pre-requisites
Before starting this tutorial, you should:
- PHP Version 7 or later
- Apache 2 or later
- JSON is enabled
Take a look at this how to guide If you are using a desktop version of the Dashboard Builder in MS Windows.
Real-time Dashboard runs on all SVG-compatible browsers such as:
- Windows 7 or later /Linux 3 or later
- Firefox 52, Chrome 57, IE
- Real-time Dashboard Builder is available for downloading
Installation
There is a Free version of the real-time dashboard builder also available
- You can download the dashboard dashboard code fromDownload Dashboard Builder
- Place the files in a directory on the web server. e.g.
…/www/yoursite/dashbboardbuilder-v4-FREE/ - Unzip
 the file dashboard.zip using Extract Here option to the root folder of "dashboardbuilder"
Fetch data from MySQL
With the help of the following easy steps, you can fetch complex data from the MySQL database and create the highest level of extremely attractive predictive analytic dashboards for professional businesses with no code and without programming skills required, in a matter of minutes.
- Retrieve data from MySQL dashboard
- Assign data to X and Y-axis column.
Retrieve data from MySQL dashboard
This section of the article helps you to understand how to connect to the MySQL database. To proceed further, you need to make sure that you have already installed the dashboard builder tool and you meet all the prerequisites .
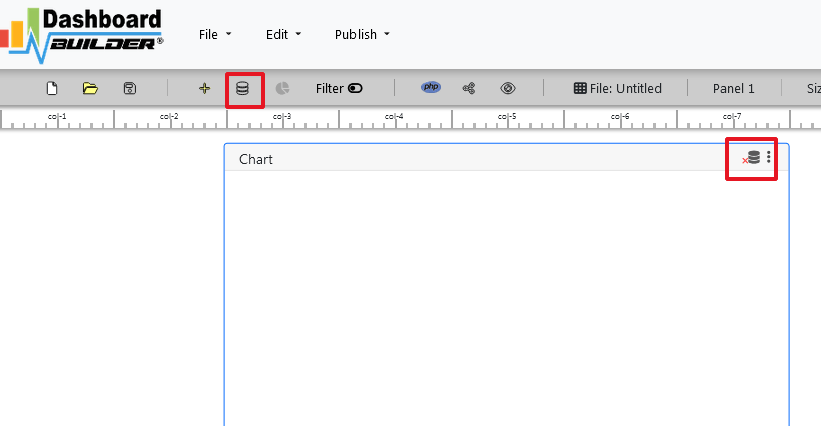
- STEP-1 Launch the dashboard builder, if you are using on-prem version then run the dashboard builder in a browser
- STEP-2 Click the database icon
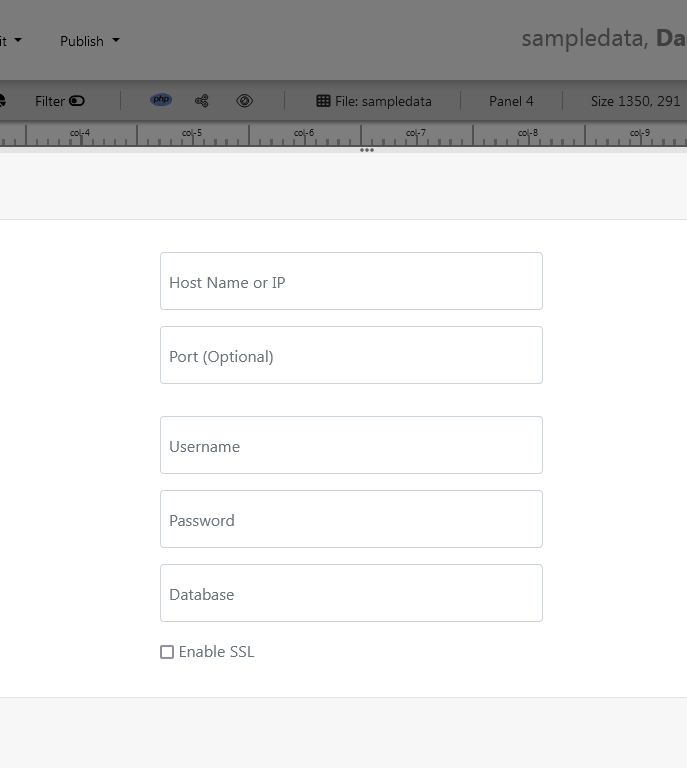
- STEP-3 On the database tab, enter the database credentials of your database and hit the Save Changes button.
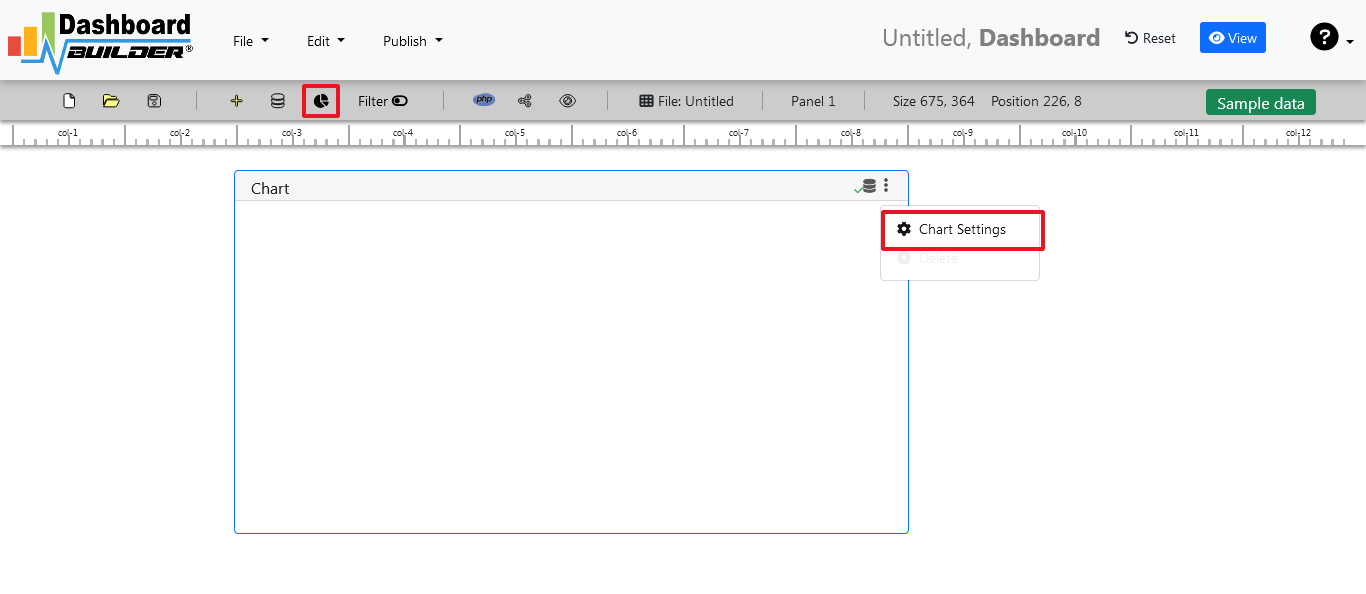
- STEP-4 Click the gear icon to open the chart properties windows
- STEP-5 On the next screen; select Line graph from the drop-down list of chart type. Select order date in X-axis and unit sold in Y-axis
- STEP-6 Now, click the Analytics tab.
- STEP-7 Save your changes and your business forecasting dashboard is ready. You have various options to publish your forecasting dashboard.


Aggregate sum monthly sales by check the month on X-axis in ascending order and Sum on Y-axis.


the forecast number is enabled, you must have a date in your X-axis in order to forecast your sale otherwise this button would not be enabled.
We can see here again in the solid line this is our actual data. And then based on the actual data and pattern over time with that data, the dashboard builder can through various statistical algorithms produces a forecast of what we should expect.

Enter the number of iterations we want to the dashboard builder to forecast.
Video tutorial on how to create a Forecasting dashboard with Dashboard Builder®
Share your business forecasting dashboard with your team
You can publish and share your dashboard with your team using just one click. This great dashboard tool for the real-time Dashboard generates the URL for your dashboard to share with your colleagues. Not only this, the dashboard builder has a powerful PHP code generator plugin installed, which generates PHP code for your dashboard in just one click. This auto-generated PHP code for your dashboard is published under the MIT license, which you can customize as per your desired needs and can be used or embedded inside of your PHP application.
 the file dashboard.zip using Extract Here option to the root folder of "dashboardbuilder"