AI Dashboard Software — Ask Your Data Questions in Plain English
An AI dashboard lets you analyze your data by asking questions in plain English instead of writing SQL or manually building charts. Dashboard Builder connects to ChatGPT, Gemini, or DeepSeek so you can type something like "compare monthly sales for the last six months" and get an instant, accurate chart back.
What Is an AI Dashboard?
An AI dashboard is a data visualization tool that uses machine learning and natural language processing to automate analysis. Instead of static charts you have to manually rebuild every time your question changes, you type or speak a query and the AI maps it to your data, picks an appropriate chart, and renders it — detecting anomalies and surfacing trends along the way.

This is different from Dashboard Builder's AI Dashboard Generator, which turns an uploaded CSV, Excel, or PDF file into a dashboard automatically. An AI Dashboard is the conversational layer on top: once a dashboard exists — built manually, or generated automatically — you can keep asking it new questions in natural language rather than reconfiguring charts by hand.
How an AI Dashboard Works
Connect your data. Import files or link your databases and APIs — the AI maps and prepares the data automatically.
Ask questions in natural language. Type or speak your query — for example, "compare monthly sales for the last six months."
The AI generates visuals. Charts, graphs, and metrics update instantly as your data or your question changes.
Share and collaborate. Give your team secure, role-based access to view, edit, or query the same dashboard in real time.
Ready to try it? Start free — no credit card required.
Choosing Your AI Engine: ChatGPT vs. Gemini vs. DeepSeek
The integration process inside Dashboard Builder is the same regardless of engine, but each one has different strengths depending on your data:
Want the details on each? See ChatGPT Dashboard, Gemini Dashboard, or DeepSeek Dashboard for engine-specific setup guides.
Connecting Your AI Engine (Step-by-Step)
This workflow is the same across the On-premises, Online, and Desktop versions of Dashboard Builder.
Generate an API token. Create an API key from your chosen provider's console (OpenAI, Google AI Studio, or DeepSeek).
Add it to Dashboard Builder. Navigate to integration settings and paste your API token to connect the dashboard to your chosen AI engine.
Run your first analysis. Trigger the AI to scan your dataset — it uses NLP to process the data and extract patterns without manual configuration.
Review your results. The AI returns a synthesis of visuals and text summaries interpreting the underlying trends — save or export the report as CSV, or share it with your team.
Key Features
Industry Use Cases
 Monitor transactions, detect fraud, and forecast market trends with real-time anomaly detection.
 Predict patient outcomes, optimize resource allocation, and support diagnostics.
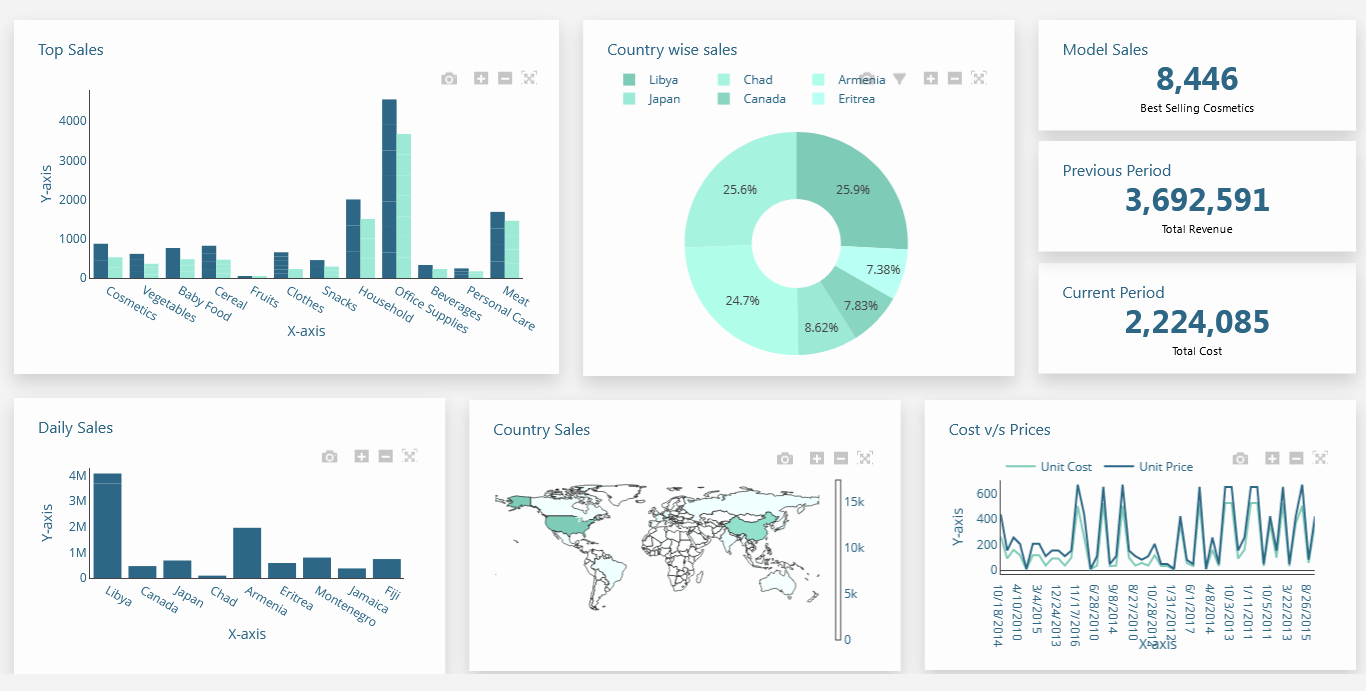 Segment customers, track sentiment, and adjust campaigns in real time based on performance.
 Optimize logistics, inventory levels, and demand forecasting to reduce delays and costs.
Frequently Asked Questions