Dashboard Builder for Every Team: Sales, Marketing, Ops & Finance
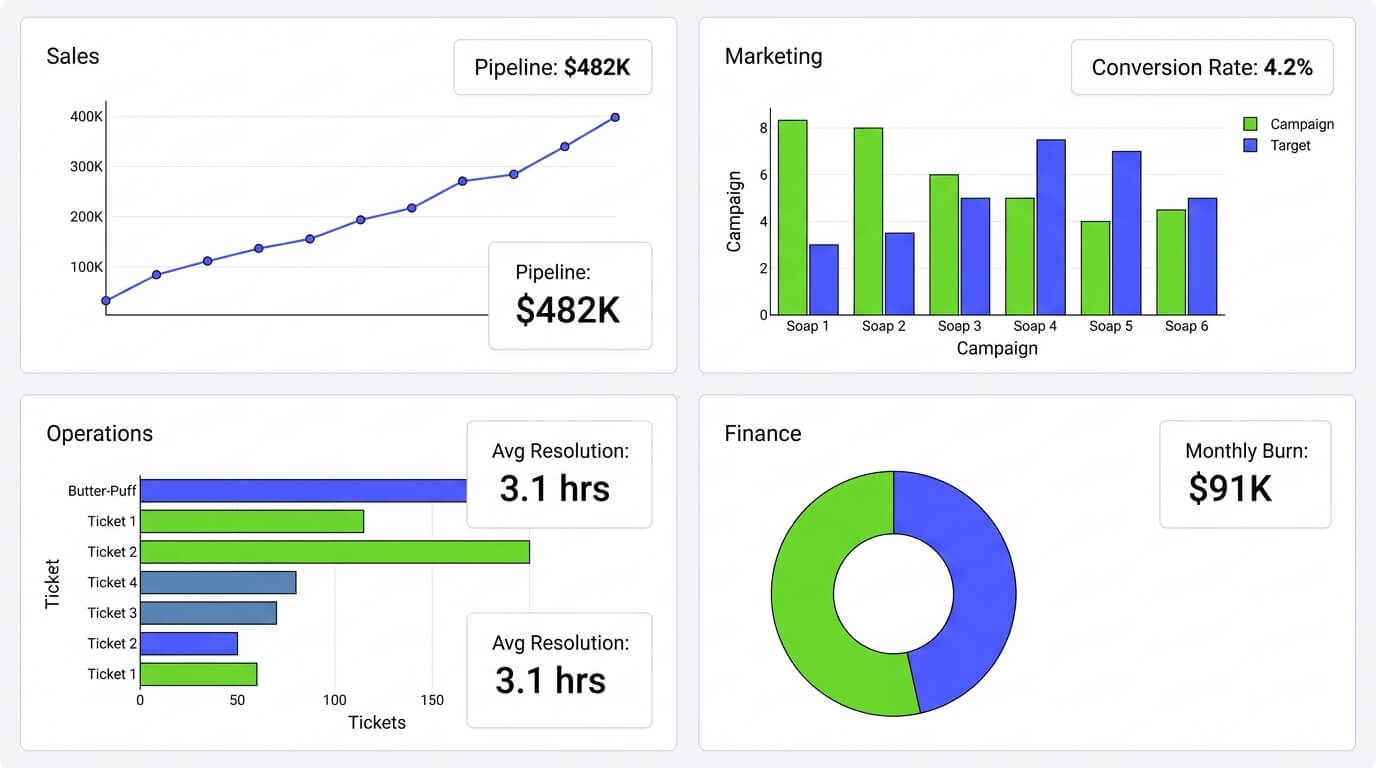
Most “dashboard builder” tools are built for one department and bolted onto the rest of the company afterward. Dashboard Builder works the other way around: connect any data source once, and the same no-code tool builds a sales dashboard, a marketing dashboard, an ops dashboard, or an internal admin tool — without a separate license, a separate login, or a separate vendor contract for each team.
What Is a No-Code Dashboard Builder?
A no-code dashboard builder lets you connect a database, spreadsheet, or file, then drag-and-drop your way to charts and KPI cards — no SQL required to view the result, no developer sprint to add a new metric. Increasingly, this is how companies are building internal dashboards generally: instead of a custom-built internal tool per department (which needs ongoing engineering time to maintain), one dashboard platform is pointed at whatever data source each team already has, and each team builds its own views on top of it.
The practical effect is that a sales manager, a marketing lead, and an operations coordinator can each be looking at a dashboard that means something to them — pipeline coverage, campaign ROI, ticket backlog — while all three sit on the same underlying tool, the same data connections, and the same admin panel for IT to manage.
Building Internal Dashboards Without Vendor Lock-In
The fastest way to end up locked into a BI vendor is to let each team pick its own tool. Sales gets a CRM’s native reporting, marketing gets a separate analytics SaaS, and finance gets a spreadsheet nobody outside finance can open — and two years later, migrating any one of them means renegotiating a contract, re-training a team, and rebuilding dashboards from scratch. A few things keep that from happening:
This is also, in practice, how most companies actually adopt no-code platforms for internal tools: not with a company-wide mandate, but with one team (often ops or finance) standing up a dashboard against data they already have, and other departments following once they see it live.
Dashboard Builder by Team
The underlying tool doesn’t change from department to department — only what you point it at, and which chart types you pick. Here’s what that looks like in practice:
Comparing Dashboard Builder vs. Locked-In SaaS BI Tools
The tradeoff most teams are actually weighing isn’t “good dashboard vs. bad dashboard” — it’s flexibility and cost vs. convenience:
| Dashboard Builder | Per-department SaaS BI tools | |
|---|---|---|
| Licensing | One tool, unlimited internal use | Separate license/seat cost per team, per tool |
| Data hosting | Self-hosted or cloud, your choice | Vendor’s cloud, fixed to their region/terms |
| Switching cost | Low — standard SQL/file connections, exportable code | High — dashboards and connectors rebuilt per vendor |
| Setup for a new team | Point the existing tool at their data | Evaluate, buy, and onboard a new tool |
| Best for | Companies standardizing dashboards across departments | A single team needing deep, tool-specific features |
Building Your First Team Dashboard (Step-by-Step)
Install Dashboard Builder on your own server, or use the cloud version if you’d rather skip hosting it yourself.
Connect the data source for that team — your CRM database for sales, your ad platform export for marketing, your accounting database for finance, and so on.
Write or select the query for the metric that team cares about, and pick a chart type — line for a trend, bar for a comparison, a KPI card for a single number.
Arrange the layout so the most-checked number is at the top, and save.
Publish and share the link with that team, or set permissions so each department only sees its own dashboard.
Repeat for the next team — the setup gets faster each time, since the tool and the admin panel are already in place.
Ready to try it? Download Dashboard Builder for free and stand up your first team dashboard today.
Requirements & Installation
Prerequisites
- PHP Version 7 or later
- Apache 2 or later
- JSON enabled
Installation
- Download the free version from the download page.
- Place the files in a directory on your web server, e.g.
…/www/yoursite/dashboardbuilder-v4-FREE/. - Unzip using the Extract Here option to the root folder of “dashboardbuilder”.
Want your team to ask questions of the data directly, instead of only viewing pre-built charts? See AI Dashboard for natural-language queries on top of any dashboard you build.
Frequently Asked Questions

Keep reading

How Much Does a BI Dashboard Cost in 2025?
How Much Does a BI Dashboard Cost in 2025? As organizations continue to rely on data for decision-making in 2025, Business Intelligence…
Dashboard Builder vs Power BI
Dashboard Builder vs Power BI An honest comparison of features, hosting and price, with Power BI prices checked on 17 October 2026.…

SaaS Dashboard — Free Cloud Dashboards | No Credit Card
SaaS Dashboard — Free, Cloud-Based (No Credit Card) Build interactive cloud dashboards, ask questions in natural language, and embed live visualizations —…