MYSQL PIVOT TABLE - Create a Pivot Table from any database and generate PHP code
Now you can create a Pivot Table from any database, including MySQL, PostgreSQL, Oracle, SQL Server, ODBC, and many more
In the realm of data analysis and organization, pivot tables stand as a pinnacle of efficiency and insight. These dynamic tools have transformed the way professionals handle large datasets, enabling them to distill complex information into easily digestible summaries and uncover hidden trends. In this overview, we will unravel the essence of pivot tables, exploring their definition, functionality, and how they empower users to unravel the mysteries of their data.

Pivot Table Overview
A Pivot Table is a dynamic data processing tool commonly found in data visualization software, allowing users to transform complex datasets into concise summaries and insights. The term "pivot" reflects the central concept of pivoting data points to view them from different angles, providing a fresh perspective on the information at hand. By rearranging, aggregating, and visualizing data, pivot tables enable multidimensional analysis, filtering, and interactive exploration, all while maintaining data accuracy and consistency. This versatile tool caters to both novice and experienced users, enhancing the efficiency of data analysis processes and facilitating informed decision-making across various industries.
Pivot tables are commonly encountered within data visualization platforms like the Dashboard Builder. Through the dashboard builder software, crafting a pivot table becomes a simplified endeavor, catering to users of varying expertise levels. This software boasts an intuitive interface, enabling both beginners and seasoned professionals to generate pivot tables without the necessity of coding. Moreover, it functions as a dynamic conduit, converting raw data into insightful outcomes, thereby amplifying the transformative potential of data analysis.
Functionality and Benefits of Pivot Tables
The true magic of pivot tables lies in their multifaceted functionality and the array of benefits they offer:
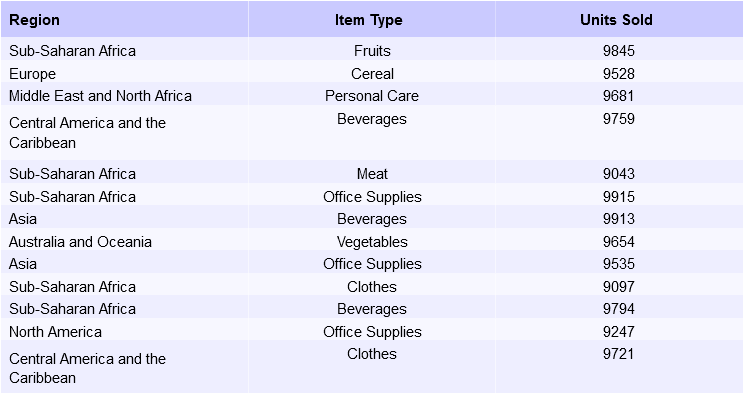
A Sample Table Example
A Pivot Table Example

1. Summarization and Aggregation:
Pivot tables excel at summarizing vast amounts of data into meaningful subtotals, averages, counts, and other aggregations. This aggregation allows users to quickly grasp the overall trends and patterns within their dataset.
2. Dynamic Rearrangement:
One of the defining features of pivot tables is their ability to rearrange data on the fly. Users can effortlessly pivot rows into columns and columns into rows, providing a customizable view of the data without altering the original dataset.
3. Multidimensional Analysis:
By allowing users to drag and drop data fields into different areas of the pivot table, these tools facilitate multidimensional analysis. This means you can explore data relationships across various dimensions, unveiling correlations that might have otherwise gone unnoticed.
4. Data Filtering and Slicing:
Pivot tables enable users to filter and slice data easily. This means you can focus on specific subsets of information, drilling down into details without losing sight of the bigger picture.
5. Interactive Exploration:
With pivot tables, exploration is a dynamic and interactive process. You can expand and collapse levels of data, instantly revealing or hiding details as needed.
6. Data Visualization:
Pivot tables seamlessly integrate with data visualization tools, allowing users to convert their summarized data into visually appealing charts, graphs, and dashboards. This visualization enhances communication and understanding of insights.
7. Data Accuracy and Consistency:
Pivot tables are linked directly to the source data, ensuring that any changes or updates in the original dataset are reflected in the pivot table. This maintains data integrity and consistency throughout the analysis process.
A Comprehensive Guide to Pivot Tables: Step-by-Step Creation
In today's data-driven world, organizing and analyzing large datasets efficiently is essential for making informed decisions. Pivot tables have emerged as a powerful tool in the arsenal of data analysts, enabling them to summarize, manipulate, and visualize data in a structured and insightful manner. In this article, we will delve into the world of pivot tables, exploring their benefits and providing a step-by-step guide on how to create them.
Assumption: Dashboard Builder 6.4 or higher version is already installed
Creating a Pivot Table - Step-by-Step Guide
Let's walk through the process of creating a pivot table using a simple example dataset. For this guide, we'll use a fictional sales dataset with columns for "Item Type," "Region," and "Units Sold."
Step 1: Open Your Data
Launch dashboard settings after establishing a database connection. And select the chart table.
In this article we have used the following query to retrieve the data
SELECT salesrecords.Region, salesrecords.`Item Type`, salesrecords.`Units Sold` FROM salesrecords Where salesrecords.`Units Sold`>9000

.
Step 2: Select Your Data
To retrieve data from your database, create your SQL query. You can also just click the desired table in the table list to retrieve the table's default data.
Step 3: Insert Pivot Table Query
On the right side, go to the "Fields" tab. A new tab will appear. You'll see a panel to configure your pivot table fields

- Row: Select the fields from the dropdown list you want to categorize your data by. In our example, select the "Region" fields here.
- Column: Select the fields you want to use as column headers. In this case, we'll add the "Item Type" field.
- Value: This section is for the numerical data you want to analyze. Select the "Units Sold" field here.
- Calculations: By default, it will display the sum of 'Unit Sold' you can select your desired formula that you want to apply. In this case, we'll select the "Sum"
- Now click the Apply button
An auto generated SQL query will be generated with a pivot table
SELECT `Region`, SUM(CASE WHEN (`Item Type`='Baby Food') THEN `Units Sold` ELSE 0 END) AS `Baby Food`,SUM(CASE WHEN (`Item Type`='Beverages') THEN `Units Sold` ELSE 0 END) AS `Beverages`,SUM(CASE WHEN (`Item Type`='Cereal') THEN `Units Sold` ELSE 0 END) AS `Cereal`,SUM(CASE WHEN (`Item Type`='Clothes') THEN `Units Sold` ELSE 0 END) AS `Clothes`,SUM(CASE WHEN (`Item Type`='Cosmetics') THEN `Units Sold` ELSE 0 END) AS `Cosmetics`,SUM(CASE WHEN (`Item Type`='Fruits') THEN `Units Sold` ELSE 0 END) AS `Fruits`,SUM(CASE WHEN (`Item Type`='Household') THEN `Units Sold` ELSE 0 END) AS `Household`,SUM(CASE WHEN (`Item Type`='Meat') THEN `Units Sold` ELSE 0 END) AS `Meat`,SUM(CASE WHEN (`Item Type`='Office Supplies') THEN `Units Sold` ELSE 0 END) AS `Office Supplies`,SUM(CASE WHEN (`Item Type`='Personal Care') THEN `Units Sold` ELSE 0 END) AS `Personal Care`,SUM(CASE WHEN (`Item Type`='Snacks') THEN `Units Sold` ELSE 0 END) AS `Snacks`,SUM(CASE WHEN (`Item Type`='Vegetables') THEN `Units Sold` ELSE 0 END) AS `Vegetables` FROM salesrecords GROUP BY `Region`;

Step 4: Explore and Analyze
Now you have your pivot table! Explore the data by collapsing or expanding rows and columns, changing the values, and experimenting with filters. This dynamic analysis helps you gain insights from your data quickly.

Conclusion
Pivot tables are a game-changer when it comes to analyzing and making sense of large datasets. Their ability to summarize, rearrange, and visualize data in a dynamic and user-friendly way makes them indispensable tools for data analysts, business professionals, and anyone dealing with data-driven decision-making. By following the step-by-step guide outlined in this article, you can confidently create pivot tables and unlock valuable insights from your data.
How helpful was this information?
Related topics
- MYSQL PIVOT TABLE - Create a Pivot Table from any database and generate PHP code
- Now you can create a Pivot Table from any database, including MySQL, PostgreSQL, Oracle, SQL Server, ODBC, and many more
- Pivot Table Overview
- Functionality and Benefits of Pivot Tables
- A Comprehensive Guide to Pivot Tables: Step-by-Step Creation
- Creating a Pivot Table - Step-by-Step Guide
- Conclusion
- Video tutorial on Mastering Pivot Tables in PHP and MySQL
- How helpful was this information?