No Code Dashboard - A Step-by-Step Guide to Create Dashboards with No Code
Discover all the resources you need to start building your own personalized dashboards with No Code

What is a No code Dashboard platform
Instead of traditional computer programming, no-code dashboard platforms allow programmers and non-programmers to create dashboard software utilizing drag-and-drop graphical user interfaces and setup.
In this post, we'll show you how to use the dashboard builder's no-code feature to create your own dashboard without writing any code. Traditionally, creating a completely unique dashboard would necessitate the services of one or more experienced software engineers. However, as the no-code landscape evolves, it's becoming easier than ever for makers all around the world to create their own complex dashboard, chart and graph.
Dashboards can take different forms, depending on the data they display and the final use case. The Dashboard Builder is the ideal visualization tool for supporting the changing requirements of a bespoke dashboard, with features such as design flexibility, data visualization, and integration.
This guide offers important advice and resources for you to consider when you begin constructing your app, whether you're trying to create a highly visible tool for your internal team or are just starting started with the Dashboard Builder.
How to Create a Variety of Dashboard Apps
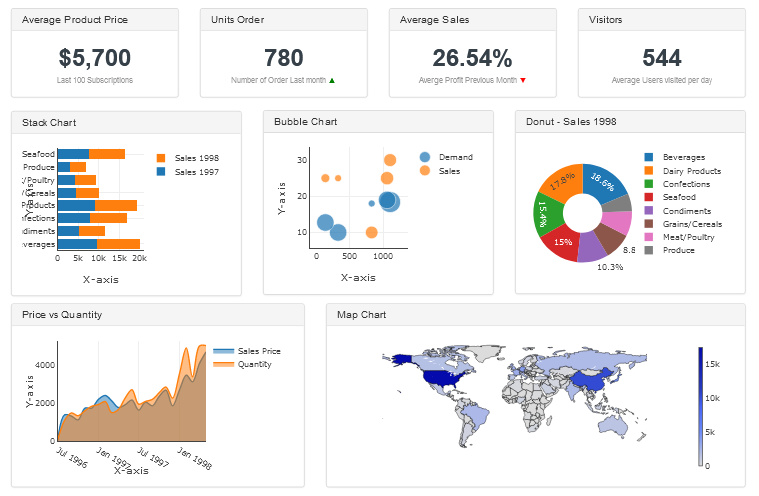
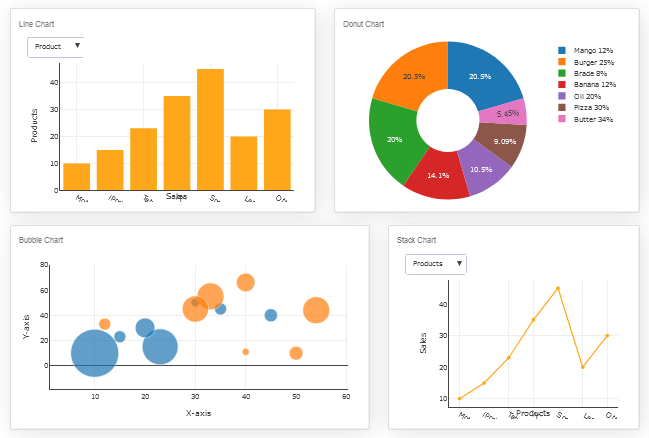
No code Dashboard platforms Showcase:
The Dashboard builder no code has been used by many users to create dashboards.Here are a few instances of what that means:
Getting Started on Your Dashboard with No-Code
Your dashboard app will only be as good as the preparation work you put in ahead of time. Let's start with the most important considerations:
- Create a User Interface for your dashboard.
- Set up the Data Sources and Structure for your dashboard.
- Create data visualizations.
Requirements
Data visualization tool can be installed any platforms like Windows, Linux and Ubuntu or any other platforms support Apache, Nginx etc.
- PHP Version 7.2 or later
- Apache 2 or later
- Windows 7 or later /Linux 3 or later
- Firefox 52, Chrome 57, IE 8
Installation
There is a Free version of Dashboard Builder available for trail bases,
- Download from https://dashboardbuilder.net/download-free-dashboard
- Place the files in a directory on the web server. e.g.
…/www/yoursite/dashbboardbuilder-v3-FREE/ - Unzip
 the file using Extract Here option to the root folder of "dashboardbuilder"
Create a User Interface for your dashboard
- Run the web folder in your browser. e.g. http://localhost/dashboardbuilder following welcome screen will appear.
- This is the main panel of the Data visualization tool. This is a HTML5 based fully responsive interface built in PHP, HTML, JavaScript and CSS. The interface has a minimal design with a drag-and-drop feature that allows you to add multiple chart panel to customize the dashboard on according to the way you want.
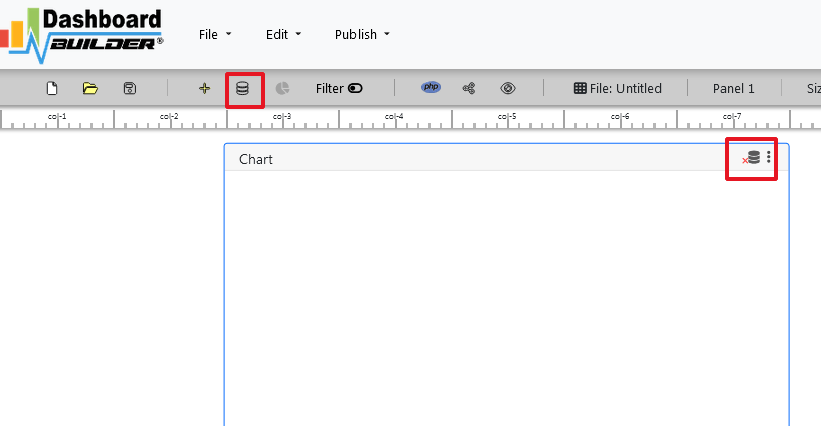
Set up the Data Sources and Structure for your dashboard
- Now Click the Database icon
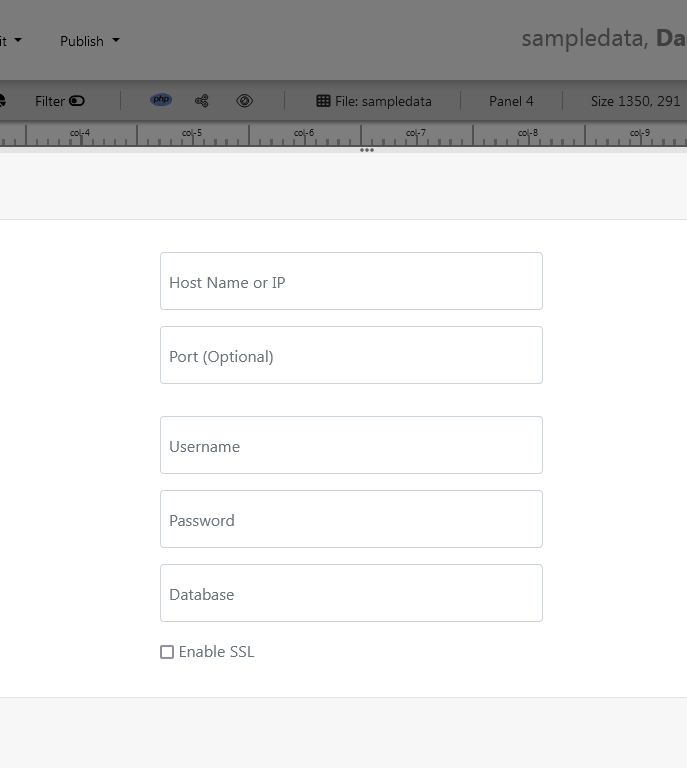
- Following screen will appear. In our Data visualization example, we will use the sample SQLite database called Northwind.db to connect and fetch the data. Now, Select Database from data source tab. Select SQLite from the drop down list of Database, Enter your
"../data/Northwind.db"in the DB name field and Save changes as mentioned in the screen.
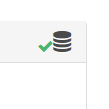
- When you click the save changes, a green tick mark with Database will appear that shows that your database is successfully connected.
Create visualizations with no code dashboard platform
- In our next step, we will fetch data from the database we have just connected. Select the gear icon for your Chart preference.
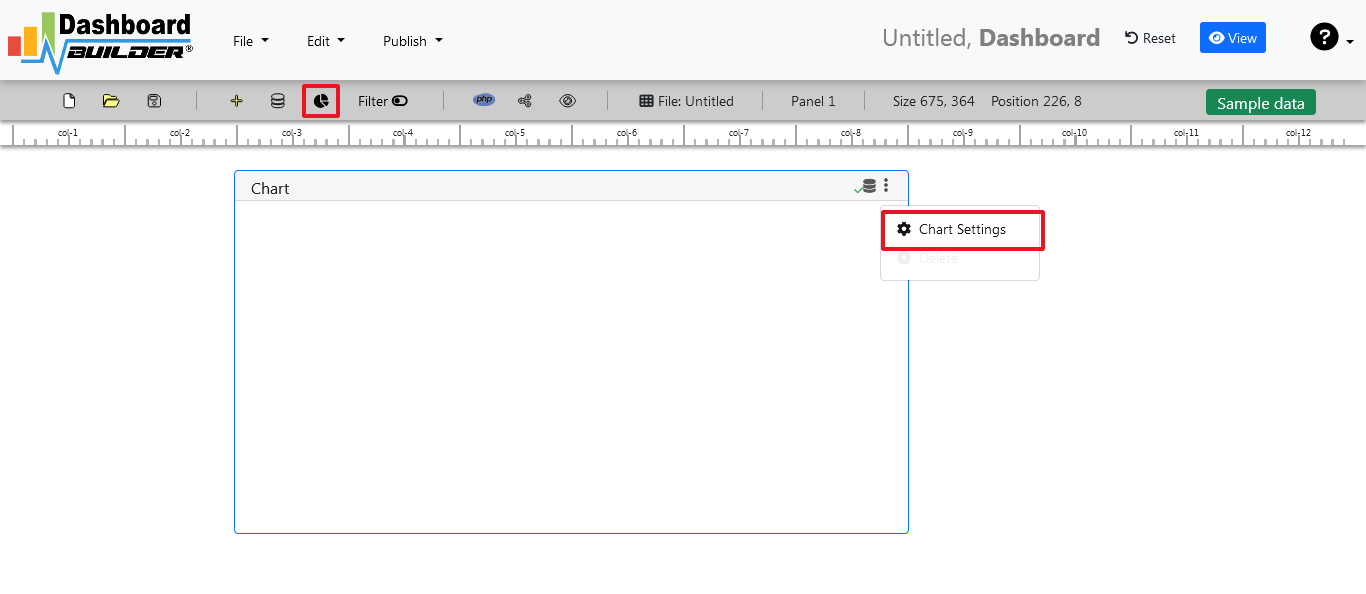
- The following screen will appear. List of the tables from Northwind.db will appear on the table list as shown in the picture below.

SQL statements
- In our example, we will be creating a simple PHP application for our sales management. This PHP dashboard will contain a chart where users can find the sales stats and maintain the data about the products.
- Now, enter the following SQL statement in text box in a following manner
SELECT strftime('%Y-%m',o.shippeddate) as xaxis, sum(d.quantity) as yaxis from `order details` d, orders o where o.orderid = d.orderid group by strftime('%Y-%m',o.orderdate) limit 50
- Now, we want to execute our query and fetch the data from the tables. Click the Run Query button

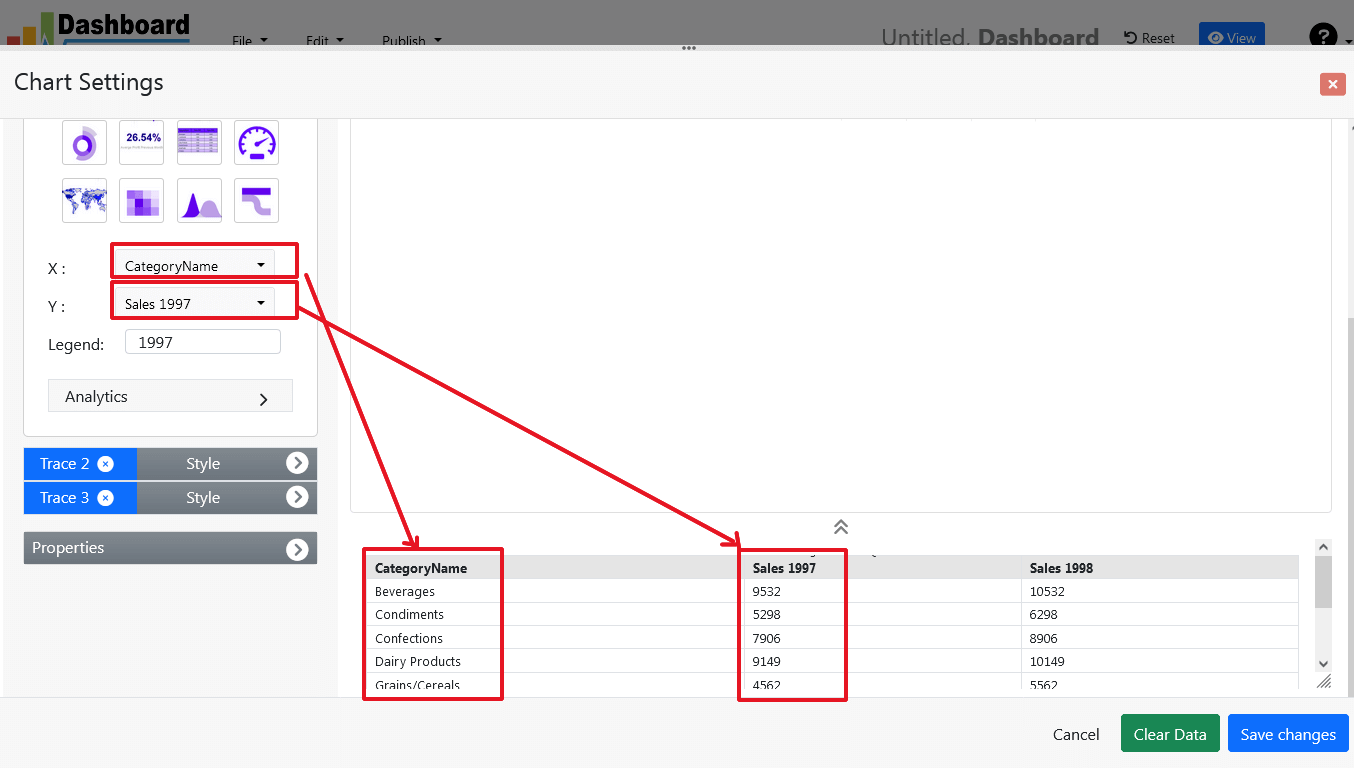
- Query Result will appear. Now, we have to assign x-axis data to the x-axis column and y-axis data to the y-axis column. Select your x-axis data from the drop down list of X and y-axis data from the drop down list of Y .
- Click Save Changes
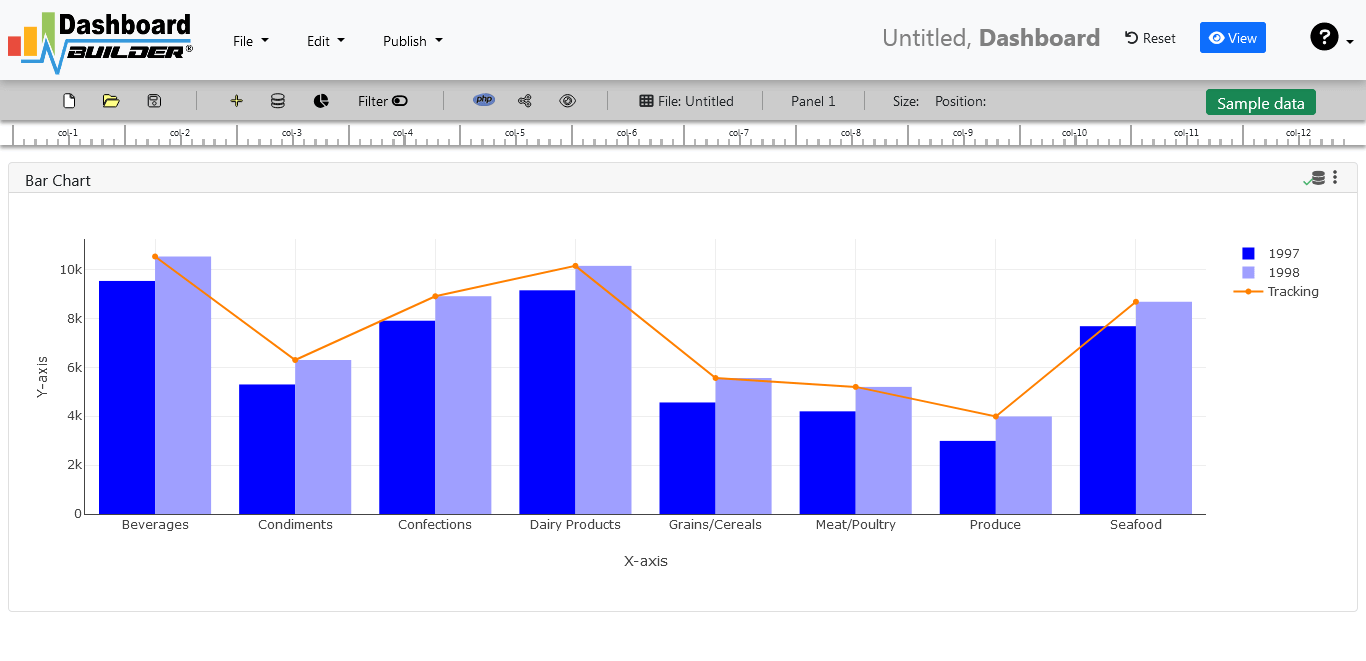
- Charts will be appeared on the screen as shown below.
Adjust the position
- You may adjust the size and the position of the Chart Panel by dragging its corner. The size and position are fully responsive according to the Bootstrap framework
PHP code generation
- So far we have successfully build our dashboard. In this step we are going to generate PHP source code for dashboard we have just created. Click the Generate button to auto-generate PHP source code for our dashboard

- PHP code for the chart will automatically generate, you may copy past this code to your PHP application.
No code Dashboard platform tool source code
Following is an example of Data visualization tool. You may copy & paste the following PHP code in your web application.
/**
 * DashboardBuilder
 *
 * @author Diginix Technologies www.diginixtech.com
 * Support  - http://www.dashboardbuilder.net
 * @copyright (C) 2018 Dashboardbuilder.net
 * @version 2.1.5
 * @license: license.txt
 */

include("inc/dashboard_dist.php");  // copy this file to inc folder


// for chart #1
$data = new dashboardbuilder();
$data->type =  "line";

$data->source =  "Database";
$data->rdbms =  "sqlite";
$data->servername =  "";
$data->username =  "";
$data->password =  "";
$data->dbname =  "data\Northwind.db";
$data->xaxisSQL[0]=  "SELECT strftime(^%Y-%m^,o.shippeddate) as xaxis, sum(d.quantity) as yaxis from `order details` d, orders o  where o.orderid = d.orderid group by strftime(^%Y-%m^,o.orderdate) limit 50";
$data->xaxisCol[0]=  "xaxis";
$data->yaxisSQL[0]=  "SELECT strftime(^%Y-%m^,o.shippeddate) as xaxis, sum(d.quantity) as yaxis from `order details` d, orders o  where o.orderid = d.orderid group by strftime(^%Y-%m^,o.orderdate) limit 50";
$data->yaxisCol[0]=  "yaxis";
$data->name = "linechart";
$data->title = "Line Chart";
$data->orientation = "";
$data->xaxistitle = "x-axis title";
$data->yaxistitle = "y-axis title";
$data->showgrid = "";
$data->showline = "";
$data->height = "167";
$data->width = "";
$data->col = "0";
$result[0] = $data->result();

?>

<!DOCTYPE html>
<html>
<head>
	<script src="assets/js/dashboard.min.js"></script> <!-- copy this file to assets/js folder -->
	<link rel="stylesheet" href="//maxcdn.bootstrapcdn.com/bootstrap/3.2.0/css/bootstrap.min.css"> <!-- Bootstrap CSS file, change the path accordingly -->

<style>
@media screen and (min-width: 960px) {
.id0 {position:absolute;margin-top:67px;}

}
.panel-heading {line-height:0.7em;}
#kpi {font-size:34px; font-weight:bold;text-align:center;}
#kpi_legand {font-size:11px; color:#999;text-align:center;}
</style>


</head>
<body>

<div class="container-fluid main-container">
<div class="col-md-12 col-lg-12 col-xs-12">
<div class="row">
<div class="col-md-4 col-lg-4 offset-md-4 offset-lg-4 col-xs-12 id0">
<div class="panel panel-default">
<div class="panel-heading">Line Chart</div>
    <div class="panel-body">
        <?php echo $result[0];?>
    </div>
</div>
</div>
</div>
</div>
</div>
</body>
The auto-generated PHP code is under MIT license, which you may customize as per your desire needs and can be used an anywhere you want. You can find the complete information about the license here
Conclusion
Now we have a PHP based dashboard that can be used with any web application that was customized to fit the requirements of the web design. The project also offers free and paid plans. You can also download No Code Dashboard Builder FREE version. The code for Dashboard Builder can be found on GitHub under this license
Best of all, with our Pro and Premium licenses include 100% source code, for you to enhance the functionality or incorporate PHP code into your web application or any PHP software solutions/products, analytics/data science/data warehouse enterprise systems or Joomla, Wordpress or Drupal sites.
All editions of our Data visualization tool series are still fully functional, for sale and supported and provides increasing levels of support to address the queries of users and developers.
No code dashboard visualization tool can also be implemented using an online API where you don’t have to mix with PHP code. The online API uses universal HTML code which can be used in any platform. The data will be added or retrieved from the database using the API. You may find more information about the Online Dashboard.
You may want to take a look at our complete documentation and video tours of the latest version along with a live tour of user interface and step by step instructions for performing key features.
OR
Get started with a free account


 the file using Extract Here option to the root folder of "dashboardbuilder"