Chart Tool for Your Website: 6 Problems It Should Solve (and How to Pick One)
Your boss wants a sales chart on the company intranet. A client wants live numbers in their customer portal. You want a dashboard in your Laravel app. It sounds simple, until you try it.
A chart tool (or charting software) turns numbers from a spreadsheet or database into charts people can read at a glance. Plenty of tools can draw a nice chart. The hard part is everything after that: keeping it up to date, getting it inside your own website or app, keeping your data private, and not paying more every time someone new needs to see it.
This guide covers the 6 problems teams run into most, what to look for in a chart tool that solves them, and how Dashboard Builder handles each one.

6 Problems a Good Chart Tool Should Solve
1. “Our charts are always out of date.”
The problem: Someone exports data to Excel, builds a chart, takes a screenshot and pastes it into a page or report. By next week it’s wrong, and someone has to do it all again.
What fixes it: a chart tool that reads straight from your data. Dashboard Builder connects directly to your database or Google Sheet, so every time the page loads, the chart shows the latest numbers. Build it once and you never re-export it.
2. “Every chart takes hours of coding.”
The problem: JavaScript libraries like Chart.js or D3.js are powerful, but each chart means writing the SQL query, the data formatting, the JavaScript and the styling, then maintaining all of it. A dashboard of 10 charts can take days.
What fixes it: drag-and-drop with a built-in SQL generator. In Dashboard Builder, you pick the table and columns, choose a chart type and click Generate. You get ready-to-use PHP/HTML5 code. Developers can still edit that code, so you keep full control without starting from zero.
3. “I can’t get the chart inside my own website or app.”
The problem: Many online chart tools only give you an image or an iframe locked to their own website. That looks out of place, can be slow, and often needs a paid plan to embed privately.
What fixes it: real code you own. Dashboard Builder generates PHP/HTML5 code that drops into WordPress, Joomla, Laravel or any PHP web application, and the charts are responsive on phones, tablets and PCs. See how to add it to WordPress.
4. “We can’t send our data to someone else’s cloud.”
The problem: Sales, finance, HR or patient data often can’t leave your company’s servers, which rules out most online chart tools.
What fixes it: self-hosting. The self-hosted edition of Dashboard Builder installs on your own Windows, Linux or macOS server (Apache or Nginx, PHP 7.4+). Your data stays on your server. If you’d rather not run a server, the cloud edition is there too.
5. “The monthly bill keeps growing.”
The problem: Most BI and charting platforms charge per user, per month. As more people need the charts, the bill grows, and it never stops.
What fixes it: a one-time license. Self-hosted Dashboard Builder starts at $119 one-time: pay once and use it forever. The Enterprise license includes unlimited users. Prefer monthly? The cloud edition starts at $9/month. Compare editions.
6. “Our data is spread across different systems.”
The problem: Orders are in MySQL, targets are in a Google Sheet and the old figures are in Excel. Most simple chart tools only read one of them.
What fixes it: many data sources in one tool. Dashboard Builder connects to 25+ sources, including MySQL, PostgreSQL, SQL Server, Oracle and SQLite, plus Google Sheets, Excel, CSV and JSON, so all your charts live on one dashboard.
Recognize these problems? Try Dashboard Builder on your own data. The self-hosted free trial never expires.
Download Free Trial See PricingChart Tool Options Compared
There are four common ways to put charts on a website. Here’s how they compare on the problems above.
| Spreadsheet charts (Excel, Google Sheets) | JavaScript libraries (Chart.js, D3.js) | Cloud BI tools (Power BI, Tableau, Looker Studio) | Dashboard Builder | |
|---|---|---|---|---|
| Coding needed | No | Yes, for every chart | No | No (code is generated for you) |
| Live data | Inside the sheet only | Yes, if you build it | Yes | Yes, straight from your database |
| Inside your own site or app | Image or iframe | Yes | Iframe, private embedding often paid | Yes, PHP/HTML5 code |
| Data stays on your server | No | Yes | Mostly no | Yes (self-hosted) |
| Cost | Free with the suite | Free, but costs developer time | Usually per user, per month | One-time license, or cloud monthly |
| Best for | One-off charts | Fully custom, developer-built charts | Internal analytics teams | Live charts embedded in your website or app |
How to Add a Live Chart to Your Website in 4 Steps
Connect your data. Pick a database (MySQL, PostgreSQL, SQL Server, Oracle, SQLite and more), a Google Sheet, or an Excel, CSV or JSON file.
Get the data you need. Use the built-in SQL generator in a few clicks, or write your own query.
Build the chart. Choose a chart type, assign columns to the X and Y axis, and style it with drag-and-drop.
Embed or share it. Click Generate to get PHP/HTML5 code for WordPress, Joomla, Laravel or your own app, or share the chart with a link.
Chart Tool, Chart Builder and Chart Maker are different names for the same Dashboard Builder feature. For a full walkthrough with screenshots, see the Chart Builder guide. Only have a spreadsheet and need a chart right now? Upload an Excel, CSV or PDF file to the free AI Dashboard Generator.
Which Chart Should You Use?
Dashboard Builder supports these and 20+ chart types in total, including area, bubble, stacked bar, gauge, heatmap and map charts, plus KPI cards for single numbers.
Which Edition Fits You?
Start free, then pick the license that matches how you’ll use it. All self-hosted licenses are one-time payments. All prices are in US dollars.
Free Trial
$0
Try it on your own data
- Self-hosted, never expires
- Watermark, fewer features
Essential
$119
Remove the watermark
- One-time license
- 1 month of support
- Encrypted code
Best for developers
Professional
$399
Customize it in your own app
- Full source code
- 3 users
- 3 months of support
Enterprise
$1,499
Agencies and SaaS products
- Modify and redistribute
- Unlimited users, 5 domains
- 1 year of support, deployment help
Don’t want to run a server? The cloud edition starts at $9/month with a 5-day free trial. Need it on one PC? Get the Windows desktop version.
Frequently Asked Questions
Stop Rebuilding Charts by Hand
Connect your data once, embed live charts in your website or app, and keep your data on your own server.
Download Free Trial Buy a License Try Cloud EditionKeep reading

Aplicativo de Dashboard: crie dashboards no Windows e na web
Um aplicativo de dashboard (ou dashboard app) é um software que transforma os dados do seu banco de dados ou das suas…

How to Reduce Latency in Real-Time Analytics Dashboards
How to Reduce Latency in Real-Time Analytics Dashboards Learn how to reduce latency in real-time analytics dashboards with faster data pipelines, optimized…

Web Push Notification Alerts to a Dashboard
Web Push Notifications for Dashboards: Turn KPI Changes into Instant Alerts A dashboard only helps when someone opens it. Web push notifications…

Free AI Dashboard Generator from Excel, CSV & PDF
From a raw spreadsheet or PDF to a complete dashboard in seconds Written by George Lewis — Head of Data Visualization &…
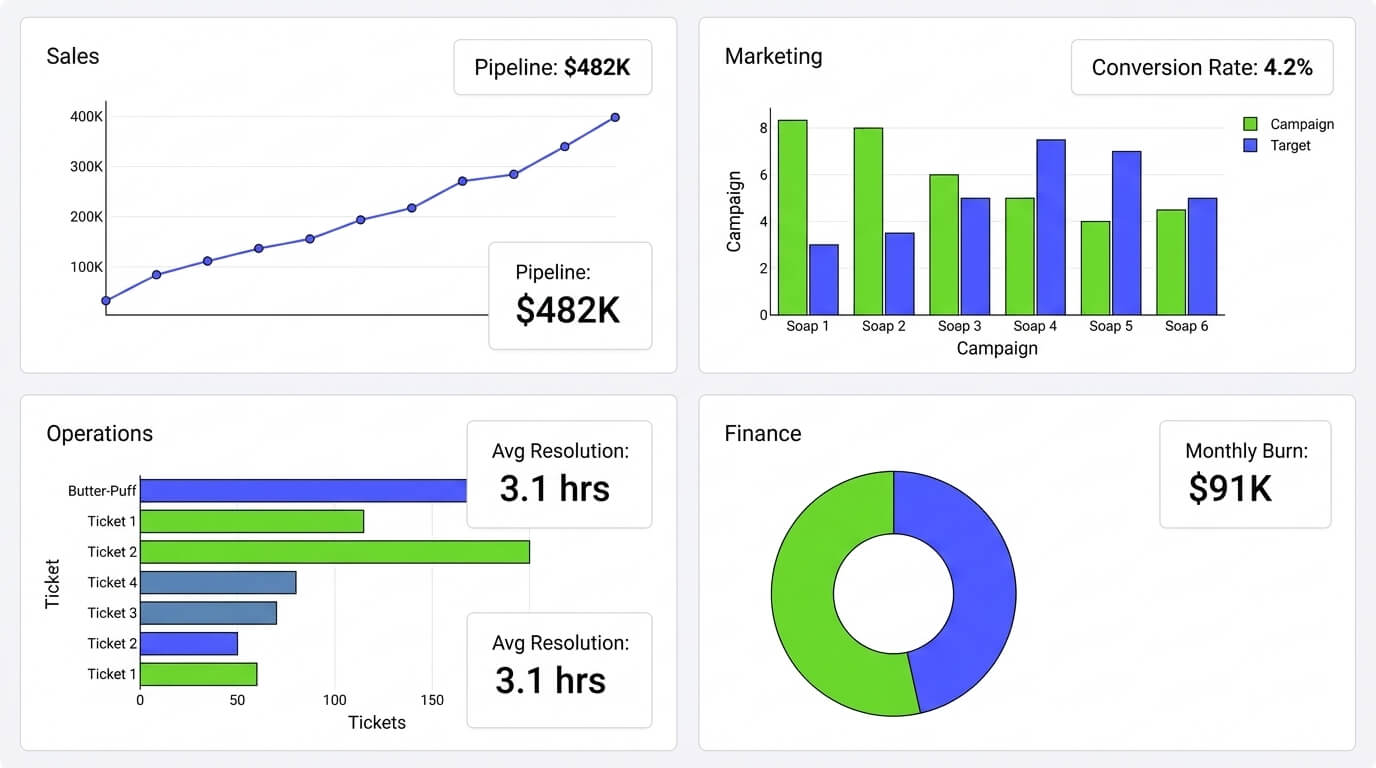
Dashboard Builder for Every Team
Dashboard Builder for Every Team: Sales, Marketing, Ops & Finance Connect any data source once, and the same no-code tool builds a…

Keep reading
Dashboard Builder for Every Team
Dashboard Builder for Every Team: Sales, Marketing, Ops & Finance Connect any data source once, and the same no-code tool builds a…
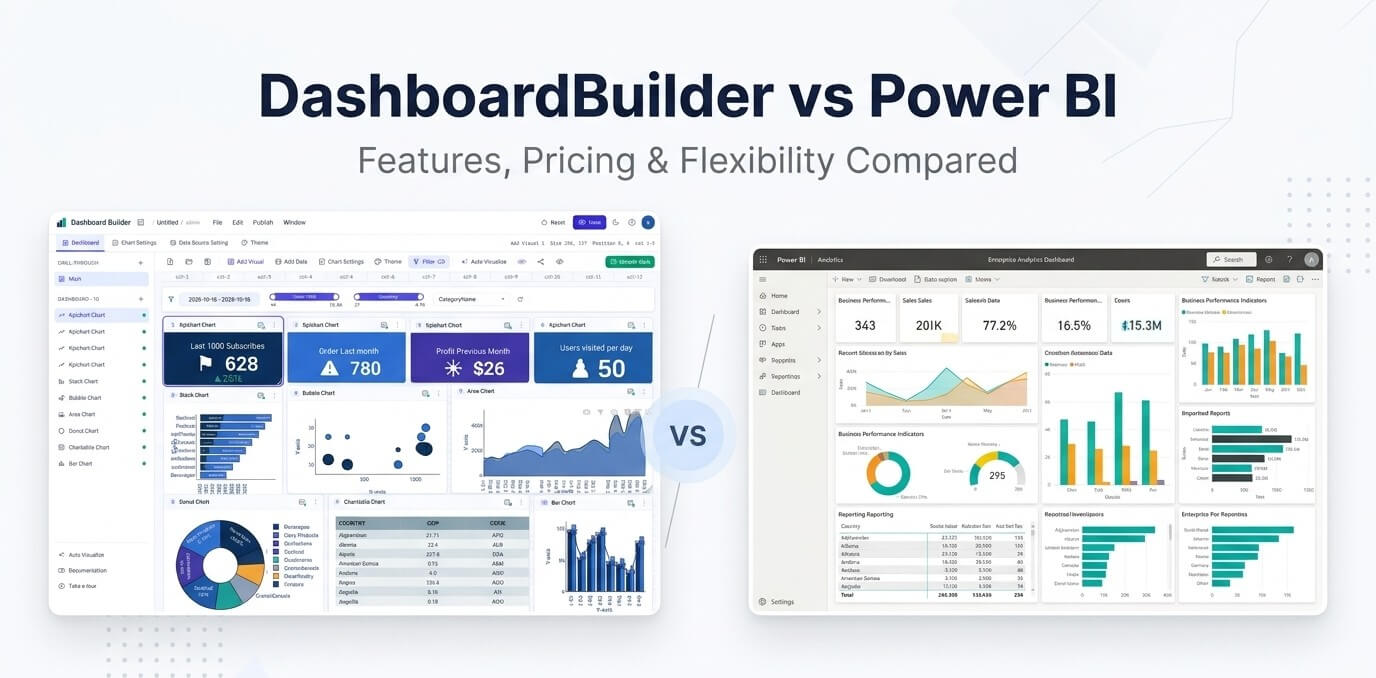
Dashboard Builder vs Power BI
Dashboard Builder vs Power BI An honest comparison of features, hosting and price, with Power BI prices checked on 17 October 2026.…

SaaS Dashboard — Free Cloud Dashboards | No Credit Card
SaaS Dashboard — Free, Cloud-Based (No Credit Card) Build interactive cloud dashboards, ask questions in natural language, and embed live visualizations —…