How to Create a Box Plot Chart and Embed It in Your Website (in Minutes, Not Days)
Your report says the average salary in Sales is $72,000. Your manager asks, “Is everyone close to that, or are a few people pulling it up?” A bar chart cannot answer that. Neither can a line chart or a table of totals.
That is the problem a box plot solves. It shows how the values in a column are spread across each group: where the middle half sits, where the median is, and which values are far from the rest. One compact chart replaces a page of numbers.

The second problem is getting it onto your site. Writing it by hand means a SQL query, data formatting, a charting library and styling, then maintaining all of it. With Dashboard Builder 8.2 you pick the columns, choose Box Plot and get a live chart that runs on your own web page. This guide shows you how, step by step.
The Real Problems Behind “I Need a Box Plot”
1. “The average looks fine, but I don’t trust it.”
The problem: A bar of averages or totals hides how much the numbers vary. Two departments can share the same average with very different ranges.
What fixes it: a box plot draws one box per category from every row, not from totals. You see the range, the median and the outliers at a glance.
2. “Coding a statistical chart takes too long.”
The problem: Quartiles, whiskers and outlier rules are easy to get wrong, and each chart means more query, formatting and JavaScript to maintain.
What fixes it: in Dashboard Builder you choose the chart type and two columns. The tool works out the box, the median, the whiskers and the outliers for you, and shows a live preview before you save.
3. “I can’t get it into my own web application.”
The problem: Many chart tools give you an image or an iframe on their servers. That looks out of place and means your data travels elsewhere.
What fixes it: Dashboard Builder generates PHP/HTML5 code that drops into WordPress, Joomla, Laravel or any PHP web application, and the charts are responsive on phones, tablets and PCs. See how to add it to WordPress.
How to Read a Box Plot in 30 Seconds
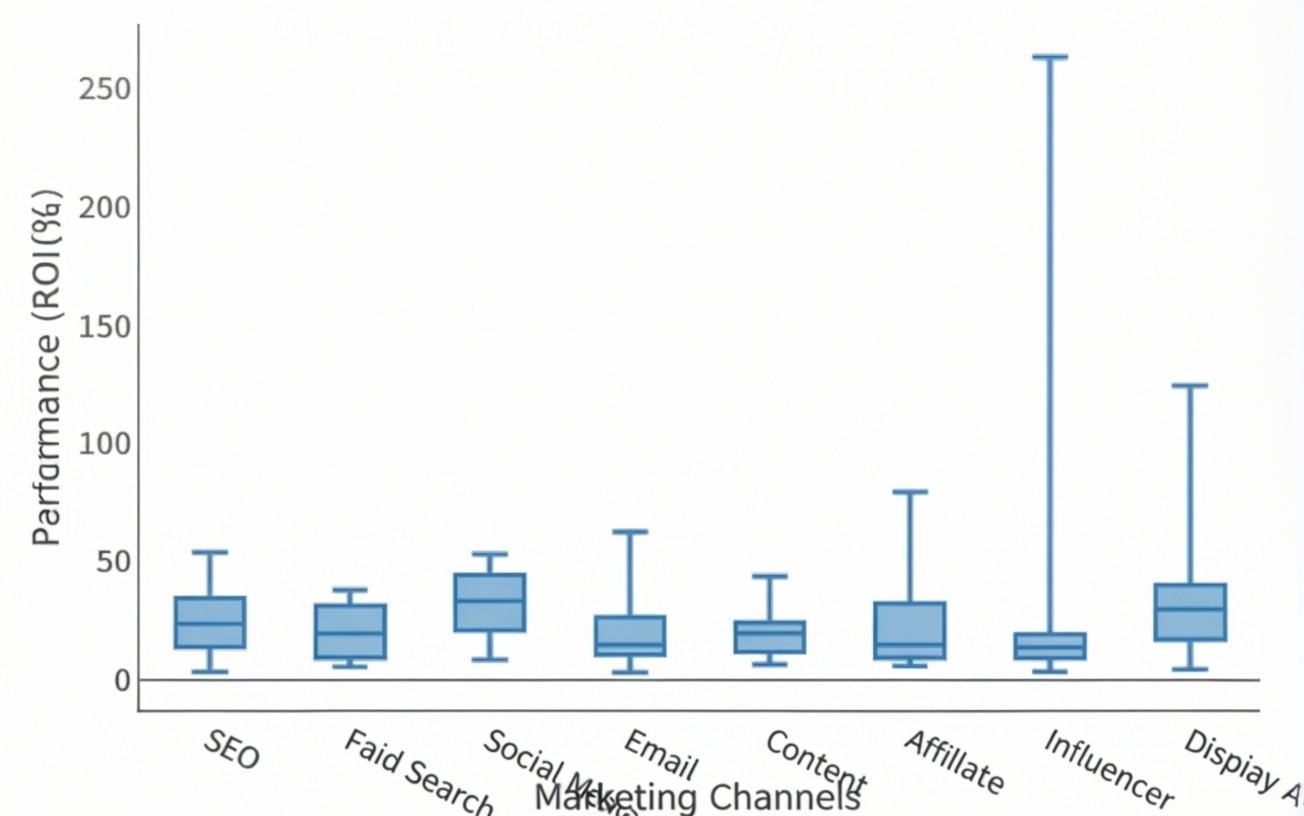
A box plot shows how the values of one number column are spread, with one box per category.
- The box: the middle half of the values, from the 25th to the 75th percentile.
- The line inside the box: the median.
- The whiskers: the normal range of the values.
- Dots outside the whiskers: outliers, values far from the rest.
- A dashed line (optional): the mean.
Use it to compare ranges between groups, for example salary by department, and to spot unusual values at a glance. Hover over a box to see its min, quartiles, median and max.
Create a Box Plot in 10 Steps
Before you start:
- Data: any source works. Use a database (MySQL, SQLite, SQL Server, PostgreSQL, Oracle and others) or a file (CSV, Excel, PDF, Google Sheets, JSON).
- Columns: you need at least one number column. A text column for the categories is optional.
- Rows: use one row per record. If your SQL uses
SUMorGROUP BY, each box gets a single value and turns into a flat line. Select the raw rows instead: all columns of the table, with no totals. - Edition: Box Plot is a commercial chart (Basic, Pro and Enterprise). More on that below.
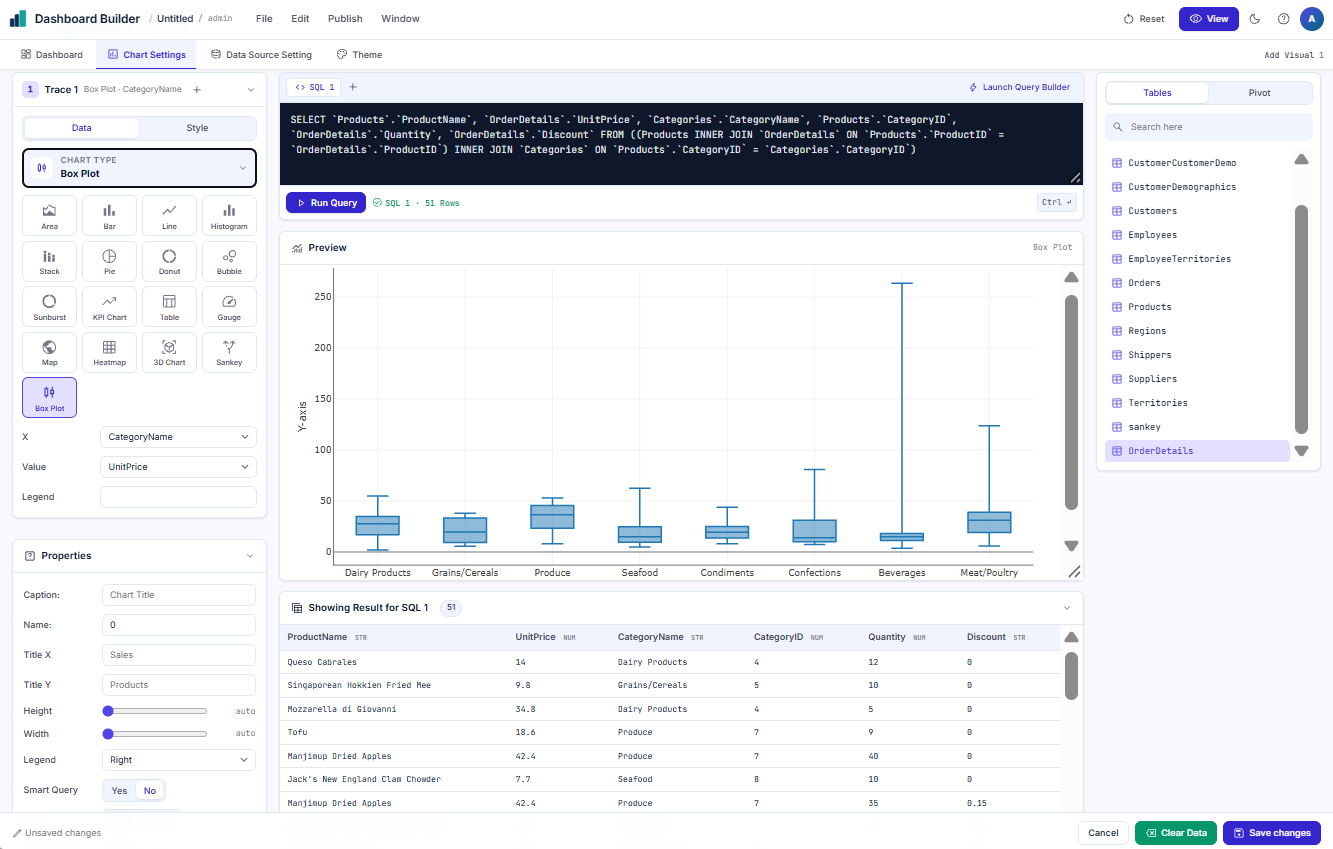
Add a visual. On the Dashboard tab, click Add Visual in the toolbar. A new empty panel appears on the canvas.
Connect your data. Click Add Data on the panel (or open the Data Source Setting tab). Upload a CSV, Excel, PDF or JSON file or paste a Google Sheets link. For a database, connect and write a query that returns the raw rows (all columns, no SUM or GROUP BY).
Open Chart Settings for the panel.
Pick the chart type. In Trace 1 → Data, open Chart type and choose Box Plot.
Set two columns. X is the category column, for example Department, which gives one box per department. Value is the number column, for example Salary. For one box over all rows, set X to the same column as Value.
Check the preview. You should see one box per category, with outlier dots where values are far from the rest.
Add titles (optional). Open Properties and add a Caption, plus Title X and Title Y.
Save the chart. Click Save changes at the bottom right.
Save the dashboard. Back on the canvas, resize or move the panel if needed, then use File → Save (or Save As) and give it a name, for example box-plot.
View it. Click View (top right) to see the published dashboard.
Want to try it first? Use the sample file boxplot-test.csv (27 rows: Department, Region, Salary, Bonus, Rating, Join Date) or open the ready-made dashboard: File → Open → box-plot. It shows every option described below.
From Chart to Your Website: Get the Code and Embed It
A chart on your own screen is only half the job. The point is to show it to your users, inside your own pages.
Dashboard Builder generates PHP/HTML5 code. It drops into WordPress, Joomla, Laravel or any PHP web application, so the box plot becomes part of your site rather than a picture or someone else’s iframe. The generated chart code is MIT-licensed and yours to use. Because it reads your data source, the chart shows your latest numbers each time the page loads, so you never re-export a spreadsheet or paste a new screenshot.
- WordPress: follow the WordPress guide.
- Your own PHP app (Laravel or similar): install the self-hosted edition on your server and place the generated code on the page where you want the chart. The download page has the install steps for Ubuntu/Linux, Windows, Git and Docker.
- Private data: the self-hosted edition runs on your own server, so your data stays with you.
Every chart is responsive, so the same box plot reads well on a phone, a tablet and a desktop.
Make It Say More: Options, Filters and Drill-Through
| Option | Where | What it does |
|---|---|---|
| Points | Properties → Points | Outliers (default) shows only unusual values as dots. All shows every row as a dot beside its box. None shows boxes only. |
| Mean | Properties → Mean | Show adds a dashed line for the average in each box. |
| Layout | Properties → Layout | Horiz draws the boxes sideways, with the values along the bottom. |
| More boxes per category | + (Add Trace) on Trace 1 | Each extra trace is another box beside the first, for example Bonus next to Salary. Give each one a Legend name. |
| Colours | Trace → Style | Colour of each box and its outline. |
| Long names | Automatic | Category names longer than 15 characters are shortened on the axis with “…”. Hover shows the full name. |
Let your users filter and drill down
Box plot filters remove whole rows, so each category keeps its own values.
- Chart filter: in Properties set Filter to Show and save. A filter icon appears in the chart’s top-right toolbar. It lists each category and each value once, and keeps the rows you leave selected.
- Dashboard filters: text columns become dropdowns (for example Department) and number columns become sliders (for example Salary). Filters combine: Department = Sales & Marketing plus Salary 50,000 to 100,000 shows only rows that match both.
- Two boxes per category: a slider on Salary also keeps the matching rows in the Bonus box.
- Drill-through: add a page, then in Chart Settings → Drill-through turn it on, choose From = X and the page. Clicking a box opens that page filtered to its category, for example Engineering.
If Your Box Plot Looks Wrong
| You see | Cause | Fix |
|---|---|---|
| Box Plot is greyed out with “Upgrade License” | FREE or KickStarter edition | Use a Basic, Pro or Enterprise license |
| Each box is a flat line | The data is already totalled (SUM / GROUP BY), so there is one value per category | Select the raw rows: all columns, no totals |
| One box only, no categories | X is the same column as Value | Pick a text column for X |
| A value is missing from the box | The cell is empty or text | Expected: empty and text cells are left out |
| Boxes look squashed by one huge value | An outlier stretches the axis | Normal for box plots. Filter it out with a dashboard slider if needed |
| The filter icon is missing | Filter is set to Hide | Properties → Filter → Show, then Save changes |
| Labels end in “…” | Category names over 15 characters | Hover to read the full name |
Watch: Create a Box Plot in Dashboard Builder
Prefer to watch? This video tutorial walks through the same steps on screen, from adding the visual to viewing the finished chart.
Start Free, Then Unlock Box Plot
You do not have to decide today. Here is a simple path.
Step 1: Try Dashboard Builder free
The free edition is self-hosted and never expires. Install it, connect your own data and build dashboards with the other chart types. Use it to check that the tool fits your data and your website before you spend anything. The free edition shows a watermark and has fewer features. In FREE and KickStarter, Box Plot appears in the chart list greyed out with “Upgrade License”, so you can see where it lives.
Step 2: Get the commercial edition for Box Plot
Box Plot is available in Basic, Pro and Enterprise. When you are ready, pick the license that matches how you will use it.
- Essential: one website, no watermark.
- Professional: full source code, so you can customize the charts inside your own app.
- Enterprise: for agencies and SaaS products.
Self-hosted licenses are one-time payments. Current prices are on the pricing page.
Frequently Asked Questions
A box plot shows how the values of one number column are spread across groups. Use it to compare ranges between categories, for example salary by department, and to spot outliers at a glance.
The box covers the middle half of the values (25th to 75th percentile) and the line inside it is the median. The whiskers show the normal range. Dots outside the whiskers are outliers. An optional dashed line shows the mean.
Any source Dashboard Builder supports: databases such as MySQL, SQLite, SQL Server, PostgreSQL and Oracle, or files such as CSV, Excel, PDF, Google Sheets and JSON. You need at least one number column. A text column for categories is optional.
Your data is already totalled, for example with SUM or GROUP BY in SQL, so each category has only one value. Select the raw rows instead: all columns of the table, with no totals.
Yes. Dashboard Builder generates PHP/HTML5 code that drops into WordPress, Joomla, Laravel or any PHP web application. The generated chart code is MIT-licensed.
No. Box Plot is a commercial chart, available in Basic, Pro and Enterprise. In the FREE and KickStarter editions it shows in the chart list greyed out with “Upgrade License”. You can try the free edition first and upgrade when you need it. See the pricing page.
Yes. Turn on the chart filter in Properties, or use dashboard filters: dropdowns for text columns and sliders for number columns. Filters combine, and they remove whole rows so each category keeps its own values.
Yes. Click + (Add Trace) on Trace 1 to add another box beside the first, for example Bonus next to Salary, and give each one a Legend name.
Your First Box Plot Is a Few Clicks Away
Download the free edition, connect your data and see how quickly a chart goes from a table to a page on your site. When you want Box Plot and no watermark, upgrade to a commercial license.

Keep reading

Tableau alternative: Dashboard Builder vs Tableau
Tableau is one of the most capable analytics platforms available, with deep visual analysis and a large community. It is also priced…
Dashboard Builder for Every Team
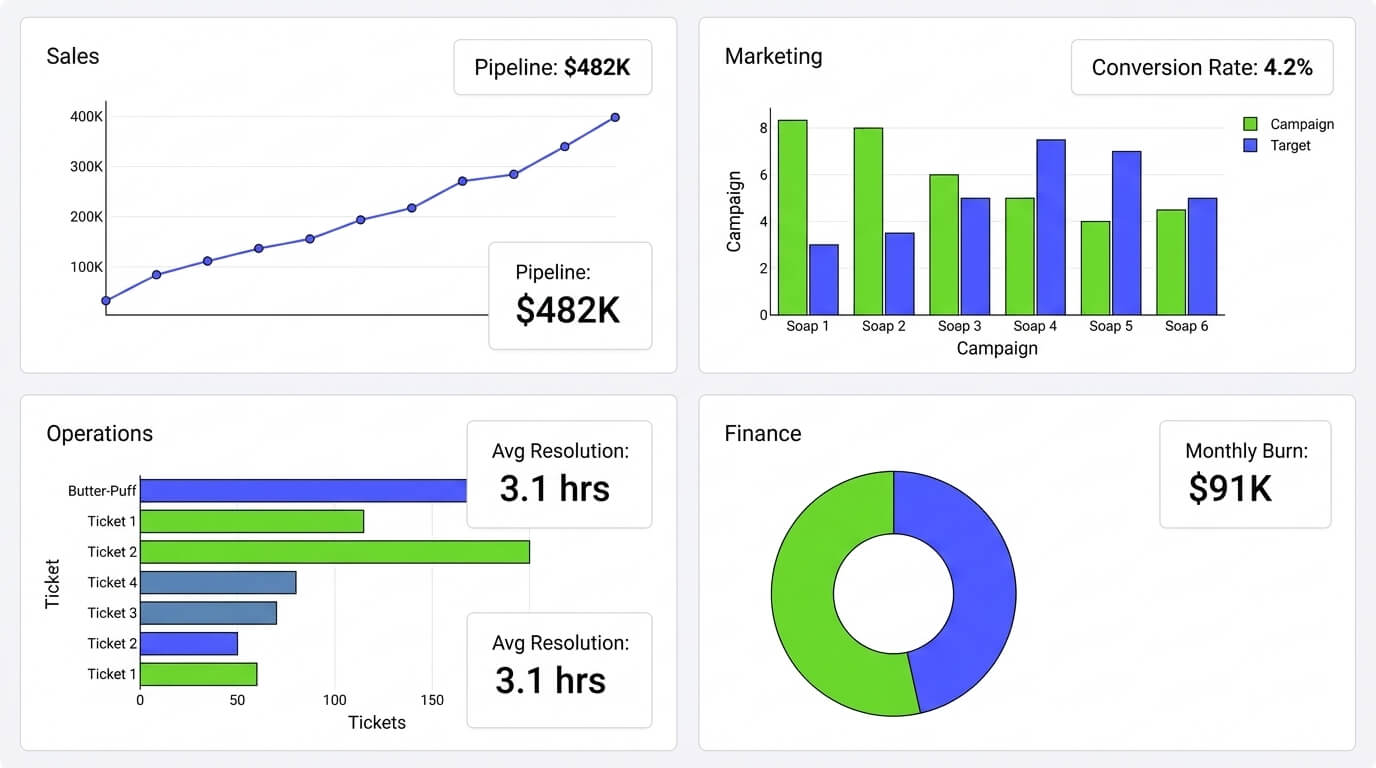
Dashboard Builder for Every Team: Sales, Marketing, Ops & Finance Connect any data source once, and the same no-code tool builds a…

How Much Does a BI Dashboard Cost in 2026?
How Much Does a BI Dashboard Cost in 2026? As organizations continue to rely on data for decision-making in 2026, Business Intelligence…