---
title: How to build a PHP Donut chart
description: "# How to build a PHP Donut chart ## Create your first PHP Donut chart with Dashboard Builder 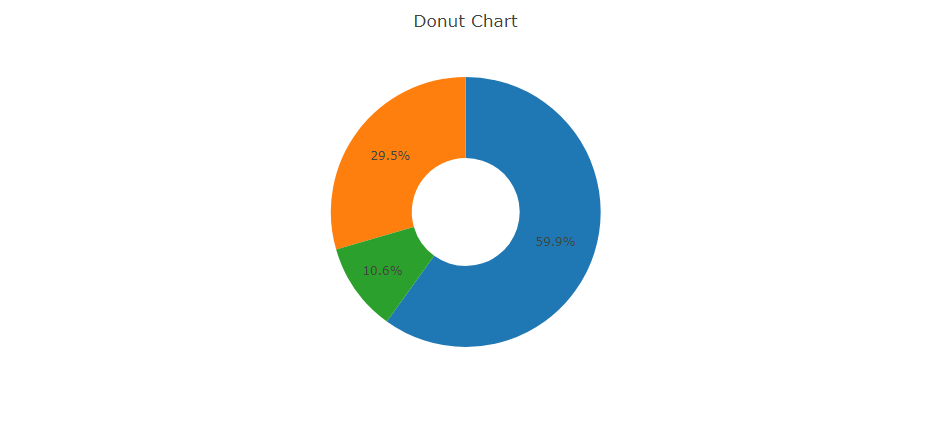 A donut chart is essentially a Pie Chart with the centre area removed.The Dashboard Builder, which does not require…"
url: "https://dashboardbuilder.net/how-to-build-php-donut-chart"
updated: "2026-10-19"
category: Charts in PHP
---
# How to build a PHP Donut chart
# How to build a PHP Donut chart
## Create your first PHP Donut chart with Dashboard Builder

A donut chart is essentially a Pie Chart with the centre area removed.The Dashboard Builder, which does not require any programming skills, is the simplest way to create a **Donut chart in PHP**. The following is how to generate PHP code for a **Donut chart** using the Dashboard Builder.
#### Requirements
- PHP Version 7.2 or later
- Apache 2 or later
- Windows 7 or later /Linux 3 or later
- Firefox 52, Chrome 57, IE 8
#### Installation
- Download from [https://dashboardbuilder.net/download-free-dashboard](/download-free-dashboard)
- Place the files in a directory on the web server. e.g. `…/www/dashboar/dbuilder/`
- Unzip the file using Extract Here option to the root folder of "dashboardbuilder"
#### Create your first Dashboard
- Access the web folder in your browser. e.g. [http://localhost/dashboardbuilder](#) following welcome screen will appear
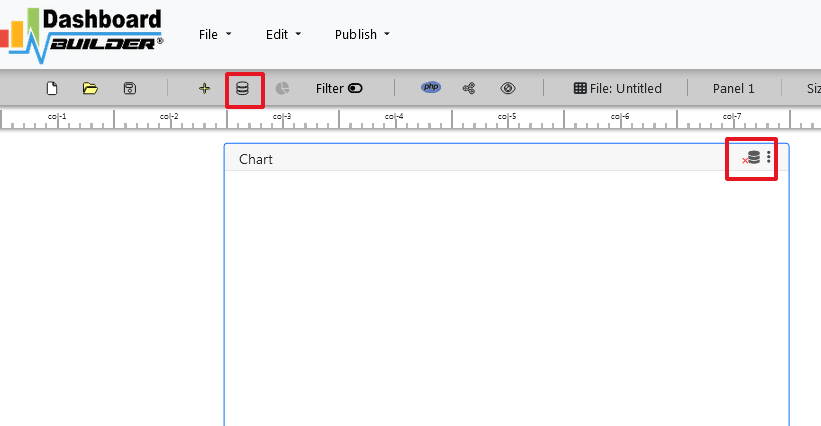
- Now Click the Database icon
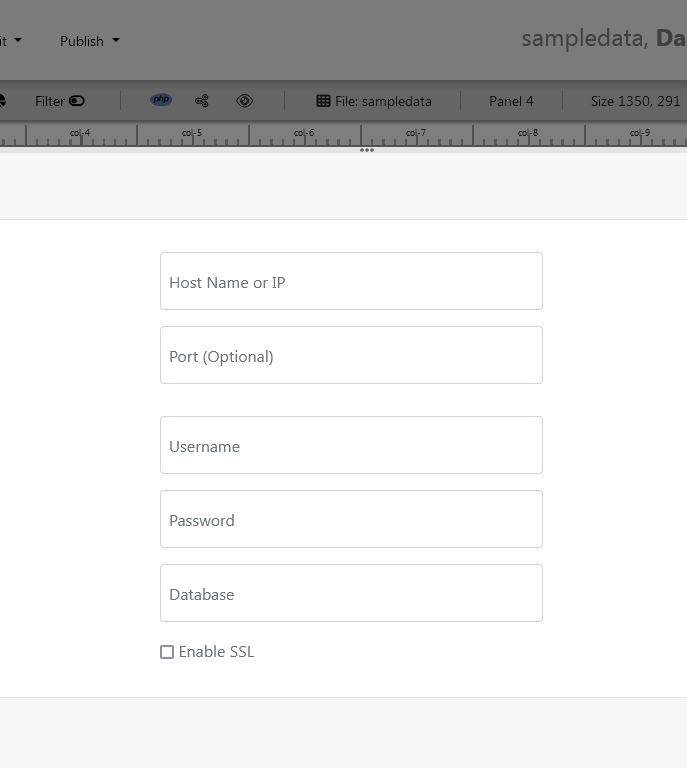
- The screen below will appear. Choose Database from the data source tab. Select SQLite from the Database drop down list, enter `"../data/Northwind.db"` in the DB name field, and save changes as shown in the screen below.
- When your database is successfully connected, a green tick mark with a Database icon will appear.
- Select the gear icon for your Dashboard preference.
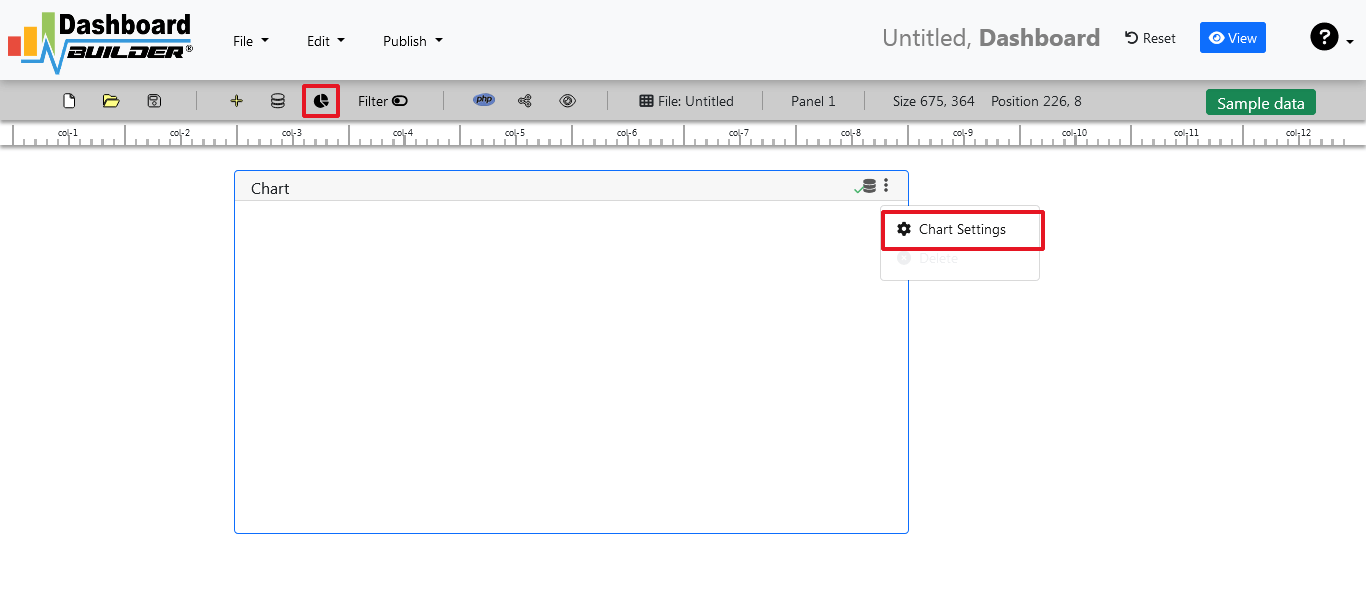
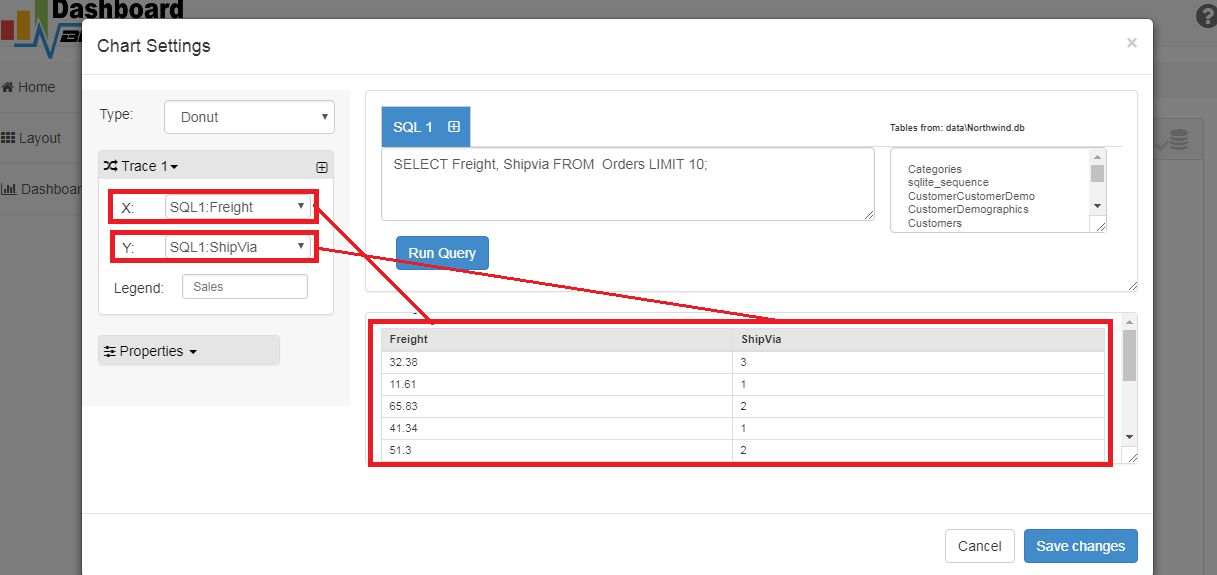
- The following screen will appear. List of the tables will appear.

- In the text box, type your SQL statement.
`SELECT strftime('%Y-%m',o.shippeddate) as xaxis, sum(d.quantity) as yaxis from `order details` d, orders o where o.orderid = d.orderid group by strftime('%Y-%m',o.orderdate) limit 50`
- Click the Run Query button

- The query result will be displayed. Now choose your x-axis data from the X drop down list and your y-axis data from the Y drop down list.
- Choose Line chart from the type drop down menu.
- Click the Save Changes button.
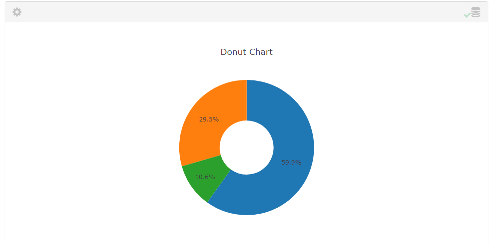
- Charts will be appeared on the screen as shown below.
- Now, expand the Generate button and select PHP Code. The **PHP code** for the chart will be generated automatically; you can copy and paste this code into your PHP application.

- PHP code for the chart will automatically generate, you may copy and paste this code to your PHP application.
#### PHP Code
```
type = "line";
$data->source = "Database";
$data->rdbms = "sqlite";
$data->servername = "";
$data->username = "";
$data->password = "";
$data->dbname = "dataNorthwind.db";
$data->xaxisSQL[0]= "SELECT strftime(^%Y-%m^,o.shippeddate) as xaxis, sum(d.quantity) as yaxis from `order details` d, orders o where o.orderid = d.orderid group by strftime(^%Y-%m^,o.orderdate) limit 50";
$data->xaxisCol[0]= "xaxis";
$data->yaxisSQL[0]= "SELECT strftime(^%Y-%m^,o.shippeddate) as xaxis, sum(d.quantity) as yaxis from `order details` d, orders o where o.orderid = d.orderid group by strftime(^%Y-%m^,o.orderdate) limit 50";
$data->yaxisCol[0]= "yaxis";
$data->name = "linechart";
$data->title = "Line Chart";
$data->orientation = "";
$data->xaxistitle = "x-axis title";
$data->yaxistitle = "y-axis title";
$result[0] = $data->result();
?>
```
The project also provides both free and paid plans. The Dashboard Builder code is available on [GitHub](https://github.com/DashboardBulder/dashboardbuilder.net) under this [license](/license).
## Need a hand?
Tell us what you’re stuck on and we’ll help you finish the setup.
[Contact support](https://dashboardbuilder.net/support)